

The divergence trading strategy is widely used by Forex traders to identify potential reversals and continuations. It occurs when the movement of a price chart and a momentum indicator move in opposite directions. This mismatch can signal weakening trends, potential reversals, or continuation opportunities, on the condition that traders have information.
It’s worth noting that traders who focus on divergence signals on higher timeframes achieve win rates of 65%. Those who chase every minor signal on lower timeframes barely scrape by with 35% success rates.
Taurex’s platform is built to support this process. Traders have access to reliable divergence detection because of MT4 and MT5’s professional charting features and integrations with expert analysis tools. Before exploring specific strategies, it’s important to understand how divergence works and why it can help traders interpret potential momentum shifts.
Understanding Divergence: Price vs. Indicator
Think of divergence as a mismatch between price and momentum. It’s like watching a car speed up while the engine starts making suspicious noises.
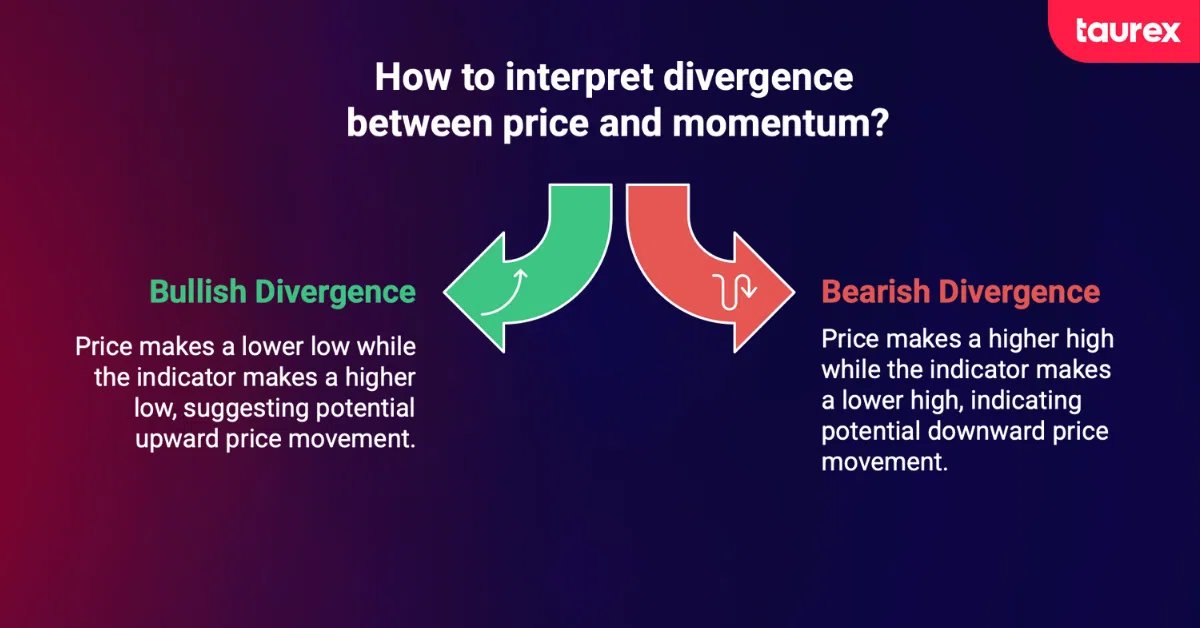
Technically, divergence happens when price action and momentum indicators (RSI, MACD, Stochastic) move in opposite directions. According to Strike Money, this mismatch shows hidden strength or weakness that price alone doesn’t reveal. For example, if price makes a higher high while the indicator makes a lower high, the bullish move may lack conviction.
A key benefit of divergence is that it’s objective. This concept forms the base of any effective divergence trading strategy, since it relies on measurable momentum rather than emotions or market noise. Indicators measure momentum, not sentiment or headlines. When momentum diverges from price, you get a clear signal that something is shifting under the surface.
Types of Divergence
Regular Divergence: Identifying Reversals
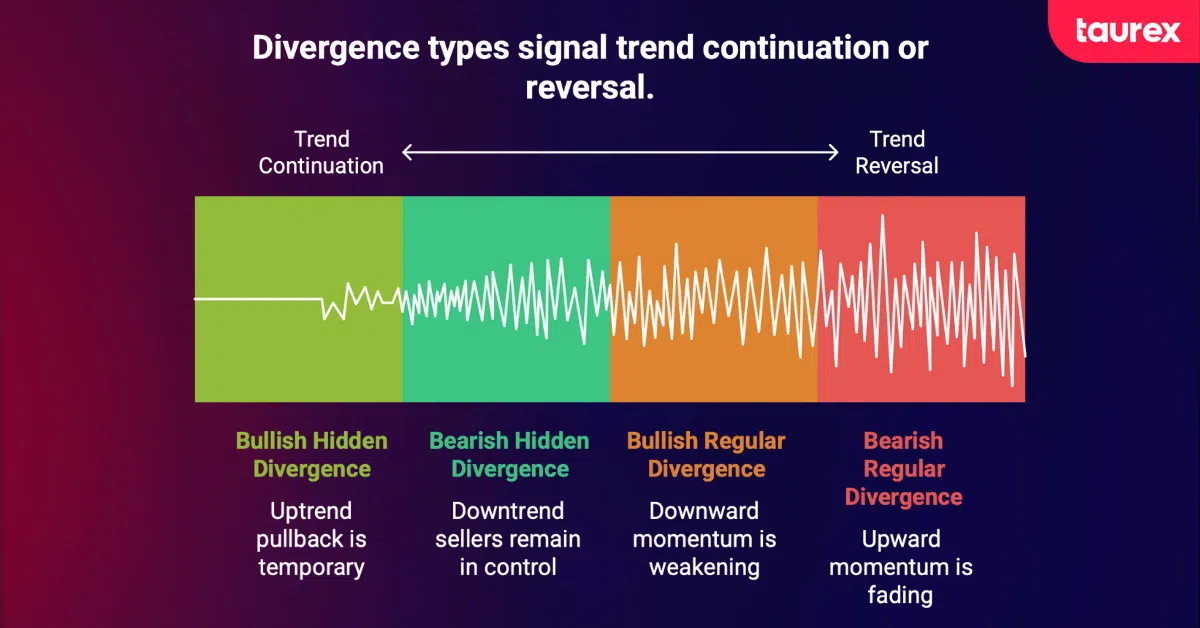
Regular divergence is one of the core setups within a divergence trading strategy that traders use to spot potential reversals. It occurs when the price moves in one direction, but a momentum indicator moves in the opposite direction. Understanding this can significantly improve trading decisions.
For example, EUR/USD may trend downward, making lower lows over several weeks. If the RSI begins forming higher lows during the same period, this is bullish regular divergence. According to HowToTrade, it indicates that downward momentum is weakening and a reversal could be approaching.
Bearish regular divergence works in the opposite way. When price makes higher highs but the indicator forms lower highs, it signals fading upward momentum. Traders using Taurex’s charting tools can consistently catch these setups, especially when combined with Trading Central analysis for confirmation.
A real-world example comes from Tesla in August 2020. TSLA displayed clear bearish divergence on the 5-minute chart near $1,900. While the price reached new highs in an ascending wedge, both RSI and CCI showed declining strength. Traders who recognised this divergence could short at the psychological resistance before the subsequent correction. (Bullish Bears)
Patience is important when it comes to trading regular divergence. Waiting for confirmation across several timeframes can greatly improve accuracy, because it often moves against the prevailing trend. As a trusted forex broker, Taurex simplifies this process by letting traders compare setups, which makes it easier to see whether an hourly divergence aligns with a key daily resistance level or not.
Hidden Divergence: Spotting Trend Continuations
Hidden divergence is most useful for trend traders. Unlike regular divergence, it signals that the current trend is likely to continue rather than reverse.
During an uptrend, if the price forms a higher low while the indicator forms a lower low, this is bullish hidden divergence. According to Alchemy Markets, it suggests that the market pullback is temporary and the trend will likely resume.
Similarly, bearish hidden divergence occurs in downtrends when price forms a lower high while the indicator forms a higher high. This pattern signals that sellers remain in control despite temporary upward moves.
LuxAlgo claims that while regular divergence works better in neutral or stable markets, hidden divergence is most helpful in trending markets. Recognising the appropriate type of divergence for current market conditions is essential for effective trading.
Identifying Divergence: A Step-by-Step Guide
A common way to identify divergence is to compare recent swing highs/lows on price with the same points on an indicator. This is where having the right platform makes all the difference, and why Taurex traders have such an edge with our advanced charting tools.
First, you need to identify the right market structure. According to the BabyPips framework, price must form one of these patterns: a higher high, flat high, lower low, or flat low. Don’t even bother looking at your indicators until you see one of these formations. This is where many traders mess up, because they see what they want to see instead of what’s actually there.
Once you have identified your price pattern, it’s time to draw your reference lines. Connect the most recent high or low to the previous major swing point, ignoring the minor fluctuations in between. On Taurex’s MT5 platform, you can use our drawing tools to mark these points precisely. Now here’s the critical part: do the same thing on your indicator. If you’re connecting price highs, connect indicator highs. If it’s lows, stick with lows.
The magic happens when these lines tell different stories. If your price line slopes up but your indicator line slopes down (or vice versa), you’ve got divergence. But here’s a pro tip that’ll save you from false signals: make sure the peaks or troughs on both price and indicator roughly align in time. If they’re too far apart, you’re probably forcing a pattern that isn’t really there.
Using Indicators to Spot Divergence in Real-Time
Several indicators are especially effective for detecting divergence, and Taurex’s platform makes applying them simple and precise.
The Relative Strength Index (RSI) is a strong starting point. According to Kavout, RSI divergence produces faster signals than MACD, particularly in range-bound markets. The default 14-period setting works well, but divergence at extreme levels—above 80 or below 20—tends to indicate stronger reversals. Many traders on Taurex use this “extreme divergence” approach to anticipate market turns on assets such as Bitcoin.
The Moving Average Convergence Divergence (MACD) indicator confirms trend direction more clearly, though it reacts more slowly. The common 12-26-9 setup remains effective, but the Linda Raschke configuration (3-10-16) can highlight early momentum changes. Mind Math Money notes that these shorter settings make MACD more responsive to shifts in strength. On Taurex, traders can save multiple templates and switch quickly based on market conditions.
The Stochastic Oscillator performs best in sideways markets. With standard 14-3-3 settings, it helps spot divergence as the price moves between support and resistance. Its faster version, the Stochastic RSI, can reveal early signs of trend change. Taurex’s charting tools allow users to overlay multiple oscillators, improving accuracy when analysing momentum.
In addition to momentum indicators, volume divergence can provide crucial confirmation. According to The5ers, shifts in volume often carry more weight than oscillator signals. When price continues to rise while volume declines, it usually points to a weakening trend and fading market participation. With access to real traded volume data on major currency pairs, Taurex allows traders to assess these signals with greater accuracy than platforms that rely only on tick volume.
Using Divergence to Trade Effectively
Spotting divergence is only the first step. Knowing how to trade it defines consistent profitability. A structured divergence trading strategy includes clear entry rules, confirmation signals, and disciplined risk management to ensure long-term consistency. Many traders identify divergence correctly but still struggle when it comes to execution.
The first rule is clear. Never trade divergence on its own. According to Wundertrading, when both RSI and MACD show divergence at the same time, the chance of a successful reversal rises sharply. Taurex’s platform supports multiple indicator windows so traders can monitor confirmations in real time.
Entry timing matters just as much. Jumping into a trade right after spotting divergence often leads to early entries. Wait until the oscillator crosses its midpoint or signal line to confirm that momentum has actually shifted. Look for clear price action signals such as pin bars, engulfing patterns, or a visible break of structure. If bearish divergence forms at resistance, wait for the price to fall below the latest swing low before entering.
One strong method is to combine divergence with key support and resistance levels. According to Tradeciety, setups that form at major price zones are usually more dependable. What Taurex’s integration with Trading Central does is mark these levels automatically. This helps traders see when divergence aligns with critical areas of the chart and improves trade accuracy.
Finally, position size should match the strength of the divergence. By that, we mean that sometimes a strong signal occurs when the price makes a clear new high or low, but the indicator does not confirm it. These situations often justify larger trades. Taurex’s risk management tools make it possible to adjust position sizes automatically based on setup strength. This keeps the approach consistent and disciplined across all trades.
Combining Divergence with Other Technical Indicators
Divergence becomes more effective when used with other technical tools. On its own, it can produce a 65% win rate, but adding confirmation greatly improves accuracy. Integrating multiple indicators into your divergence trading strategy improves accuracy and helps filter out weaker setups.
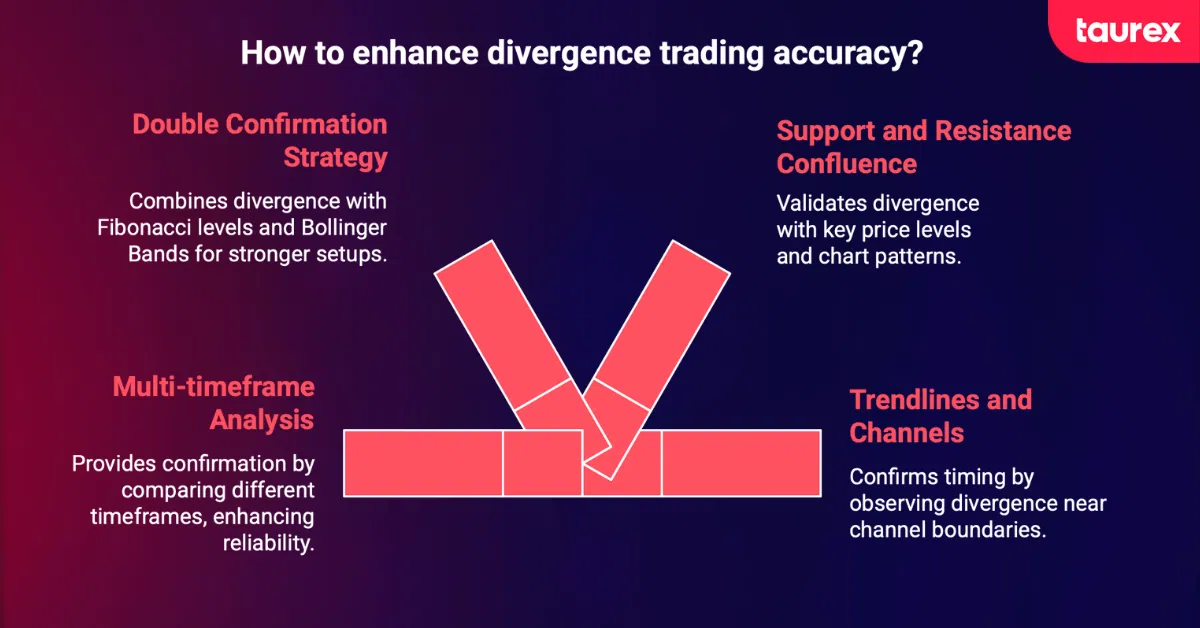
Multi-timeframe analysis is one of the best ways to confirm divergence. According to LuxAlgo, using a 4-6x ratio between timeframes gives the clearest view. For instance, if you trade from the one-hour chart, check the four-hour or daily for confirmation. Taurex’s linked chart feature updates all timeframes at once, making this process fast and consistent.
The Double Confirmation Hidden Divergence Trading Strategy also offers strong potential. This approach looks for divergence near Fibonacci retracement levels, especially between 0.50 and 0.618. Alchemy Markets notes that when price rejects these levels while showing divergence, the setup becomes much stronger. Adding Bollinger Bands, tightening at the same time, further increases reliability.
Support and resistance confluence provides another layer of validation. Imagine EUR/USD reaching a key weekly resistance. Bearish divergence appears on the daily chart, and the four-hour chart shows an ascending wedge. These signals together suggest a higher probability of reversal. With Taurex’s Acuity integration, traders can easily spot such multi-factor alignments.
Finally, trendlines and channels help confirm timing. Divergence near a channel boundary often signals exhaustion. For example, when the price touches the upper line of an ascending channel while showing bearish divergence, a short trade becomes likely. Waiting for a candle to close below the trendline confirms the move.
Best Practices for Trading with Divergence
After analysing thousands of divergence trades, certain patterns emerge that separate successful traders from the rest. Let’s look at what actually works in live markets.
First and foremost: respect the timeframe hierarchy. Divergence signals are significantly more accurate on 1-hour charts and above. Those constant divergences you see on the 5-minute chart? Most of them are just noise. Taurex traders who focus on 4-hour and daily divergences report much higher success rates than scalpers chasing every minor signal.
Always wait for confirmation, not just hoping the market will turn. You need to see the indicator actually cross over, indicating momentum has shifted. Look for a candlestick pattern that confirms the reversal. Even better, wait for the price to break a key level. Yes, you might miss the absolute top or bottom, but you’ll avoid countless false signals.
Risk management with divergence trading requires special attention. You should never risk more than 1-2% per trade, and scale your position based on divergence strength. Strong divergences at major levels might warrant 2% risk, while weak divergences in trending markets should be 0.5% maximum.
Here’s something crucial: never trade “played out” divergences. If you spot divergence but price has already moved significantly in the expected direction, you’ve missed the boat. The divergence has already played out. Start looking for the next setup instead of chasing what’s already gone.
Stop loss placement for divergence trades needs to be wider than typical setups. You’re often trading against the immediate trend, so you need room for the position to work. Place stops beyond the recent swing point, and consider using ATR (Average True Range) to set appropriate stop distances based on current volatility. Taurex’s platform calculates ATR automatically, making this process much simpler.
Conclusion: Master Divergence with Taurex
Divergence trading offers more than a standard technical indicator. It helps traders understand the forces behind price movements and anticipate potential changes in the market. When applied correctly, divergence can reveal opportunities that are not obvious from price alone.
Results from structured strategies show their effectiveness. For instance, traders using MACD-based divergence over six months have seen success rates around 74%. Adding other indicators and looking across multiple timeframes can improve outcomes further, with some traders reporting close to 90% success. These results come from careful analysis, consistent application, and proper risk management.
Taurex provides the tools needed to act on divergence efficiently. The platform supports both MT4 and MT5, integrates with Trading Central for professional insights, and offers educational resources through Taurex Academy. Compare charting capabilities and indicator support in our guide to the best FX trading platforms to find the setup that works best for your divergence analysis. These features help traders analyse divergence signals clearly and act on them confidently.
Automation and charting features give Taurex users an additional edge. Alerts, synchronised multi-timeframe charts, and professional-grade indicators make it easier to track divergence as it develops. Integrations with Acuity and Trading Central deliver insights directly to the charts in real time, helping traders make informed decisions.
Developing a repeatable divergence trading strategy allows traders to act on these signals with clarity and discipline, transforming raw chart data into actionable insights. Traders who use it systematically can spot opportunities earlier and strengthen their overall Forex strategies. With Taurex, this process becomes more manageable and gives both new and experienced traders the ability to act on momentum shifts with confidence.

