
Bitcoin prices have declined sharply by nearly 52%, representing a drop of around $66,000 from the peak recorded on October 6, 2025, near $126,000, to the low registered today at approximately $60,000. This marks the lowest level since October 10, 2024. Bitcoin is also down about 26% year-to-date and is currently trading slightly above the $64,000 level.
The key factors weighing Bitcoin prices include the following:
- A broad risk-off sentiment toward high-risk assets, particularly equities and cryptocurrencies, with a strong sell-off in technology stocks linked to artificial intelligence, especially within the software sector. At this stage, a clear correlation has emerged between these stocks and cryptocurrencies.
- Continued outflows from Bitcoin exchange-traded funds (ETFs) for the fifth consecutive week.
- A decline in total assets under management of Bitcoin ETFs from the record high of $169.4 billion recorded in October to below $98 billion, the lowest level since April 2025.
- Ongoing significant outflows from cryptocurrency investment products.
- A rebound in the US dollar index, currently trading near the 98 level, its highest since January 23, 2026, which is putting pressure on US dollar-denominated cryptocurrencies, led by Bitcoin.
- Uncertainty surrounding US monetary policy and interest rates following the appointment of Kevin Warsh, known for his hawkish stance, along with his view that the Federal Reserve’s balance sheet should remain tight or be reduced, when necessary, under quantitative tightening (QT), adding further pressure on high-risk assets.
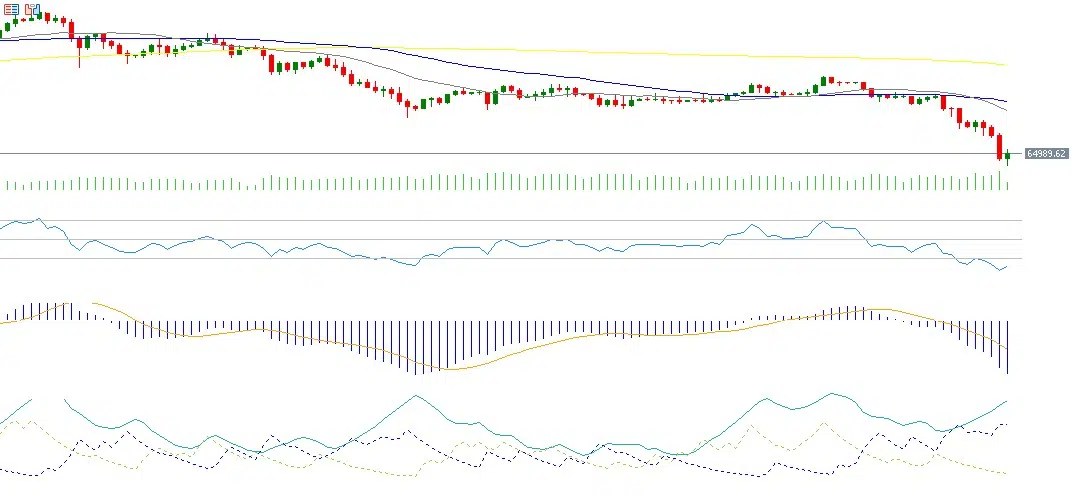
From a technical perspective, indicators continue to point to sustained bearish momentum in Bitcoin prices for the following reasons:
- A bearish “death cross” between the 20-day and 50-day moving averages on February 1, 2026, reinforcing the downtrend.
- The Relative Strength Index (RSI) is currently at 20, deep in oversold territory and at its lowest level since August 19, 2023, reflecting strong bearish momentum.
- The positive directional movement indicator (DMI+) stands near 6, compared with 42 for the negative directional movement indicator (DMI-), with a widening gap between them, signaling strong selling pressure. The Average Directional Index (ADX) is around 42, indicating a strong downward trend.
- A bearish crossover between the MACD line and the signal line within negative territory, confirming the persistence of negative momentum.
Please note that this analysis is provided for informational purposes only and should not be considered as investment advice. All trading involves risk.


