

Many Forex traders chase price without knowing where the fair value is. They buy when the market moves up and sell when it drops, which often leads to poor timing.
The VWAP trading strategy solves this problem. VWAP shows the average price based on both price and volume, and institutional traders use it to judge trade quality.
When you use VWAP, you follow the same reference that large market players rely on.
In this guide, you will learn how VWAP works, how to trade with it, and the key limits to understand when using it in Forex.
What Is VWAP (Volume Weighted Average Price) in Forex Trading?
VWAP is a simple line on your chart that shows the average price of a Forex currency pair during a trading session. It gives more weight to prices where more trading activity happened, which is why the VWAP formula uses both price and volume in its calculation. Because of this, VWAP reflects where most trading activity took place, not just where the price moved.
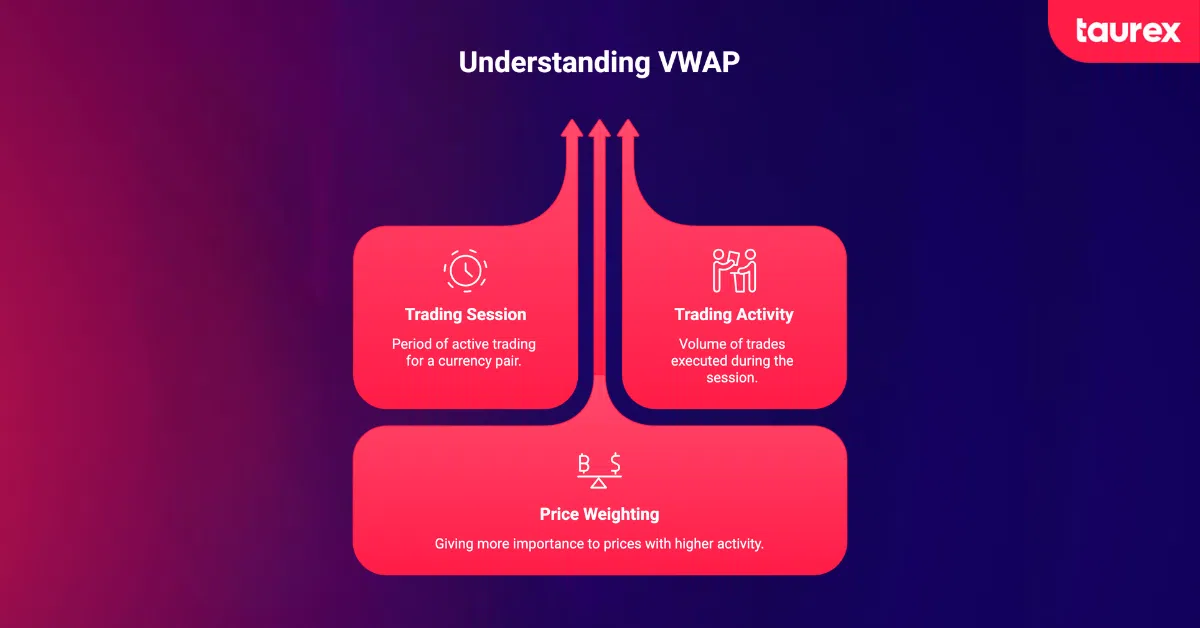
This is what makes VWAP different from a simple moving average. A moving average treats all prices the same, while VWAP focuses more on the levels with higher volume. As a result, it gives a clearer view of where real market activity is concentrated.
Institutions use VWAP as a benchmark for execution quality. If a fund’s algorithm fills a large EUR/USD order below VWAP, the desk considers that a favourable fill. If it fills above VWAP, they overpaid relative to the session’s average.
VWAP is also useful because the price often reacts around it. Traders use it to spot trends, find support and resistance levels, and time entries.
VWAP resets at the start of each trading session, which makes it primarily an intraday instrument. You will find it on most trading platforms, including MetaTrader 4 and MetaTrader 5.
Taurex’s MT4 and MT5 platforms include VWAP natively, allowing traders to overlay it on any forex pair.
How Is VWAP Calculated?
The VWAP formula is simple when you break it into steps.
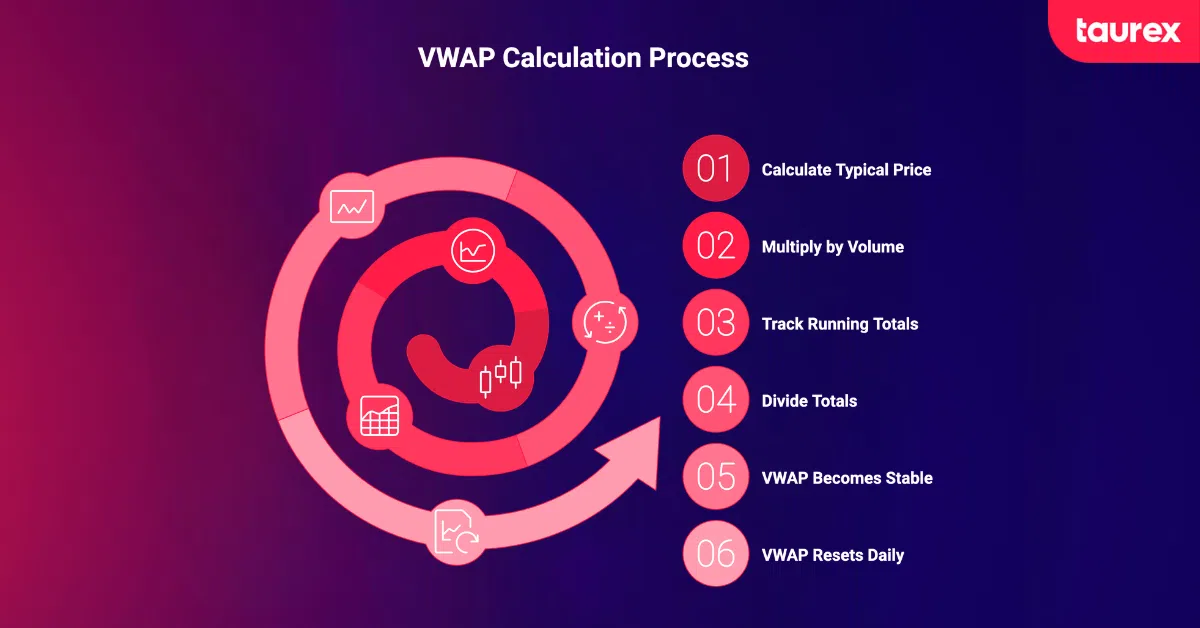
First, you find the typical price for each period. You do this by adding the high, low, and close, then dividing the result by three. Next, you multiply that value by the volume for the same period.
After that, the platform keeps a running total of both values. One tracks the typical price multiplied by volume, while the other tracks the total volume. VWAP is then calculated by dividing the first total by the second.
In practice, this means VWAP becomes more stable as the session goes on. Early in the session, a single high-volume move can shift the line quite a bit. Later in the day, new price moves have less impact because there is already a large amount of data built in.
Another important point is that VWAP resets at the start of each session. This gives you a fresh view every day, which is why it is mainly used for intraday trading. If VWAP is available on your Forex trading platform, it is calculated automatically, so traders do not need to work through the formula manually.
How to Use VWAP in Forex Trading
Knowing the formula is one thing. Knowing the formula is useful, but traders mainly need to understand how VWAP behaves on a live chart. The indicator has several practical applications that go well beyond drawing a line on your screen.
Identify Market Trends with VWAP
The simplest way to use VWAP is to understand direction.
When the price stays above VWAP for most of the session, buyers are in control. This usually signals a bullish market. On the other hand, when the price remains below VWAP, sellers are leading, which points to a bearish market.
However, not every session is clear. Sometimes, the price keeps moving above and below VWAP without holding either side. This creates a choppy market with no clear direction. In these conditions, VWAP signals become less reliable.
Because of this, it is better to wait until the price clearly stays on one side of VWAP before looking for trade setups. You should also pay attention to active Forex market hours, since stronger trends often form when market activity is higher.
Determine Support and Resistance Levels Using VWAP
VWAP can act like a moving support and resistance level that changes throughout the trading session.
When price pulls back to VWAP and holds above it, it suggests buyers are still defending that level. When the price falls below VWAP and fails to move back above it, it shows sellers are in control.
Beyond the VWAP line itself, many traders use VWAP indicator settings that include standard deviation bands at ±1 and ±2 standard deviations. These bands act as extended support and resistance zones, similar in concept to Bollinger Band outer lines.
A touch of the plus-two standard-deviation band, for instance, suggests the price has moved well above the session’s fair value.
Apply VWAP for Entry and Exit Decisions
A key rule in VWAP trading strategy is simple: do not enter a trade while the price is moving toward VWAP. Instead, wait to see how the price reacts when it reaches that level.
When price hits VWAP, the reaction matters more than the touch itself. A strong rejection, shown through a clear candle pattern, can signal a possible entry. This could be a strong bullish or bearish candle that shows a quick shift in control.
If the price slowly moves through VWAP without any clear reaction, it is better to stay out. That kind of move does not give a reliable signal.
For exits, traders often take partial profit near recent swing highs or lows. The rest of the position can be managed with a trailing stop, often placed near VWAP to protect gains while allowing the trade to run.
Best Timeframes for VWAP in Forex
VWAP is mainly used for intraday trading, so the choice of timeframe matters.
Many examples use the 5-minute chart because it gives a good balance between signal quality and trading opportunities. It is detailed enough to show reactions around VWAP without too much noise.
Some traders prefer the 15-minute chart because it smooths out small price fluctuations and still provides a clear intraday structure. Scalpers usually go lower, using 1 to 5-minute charts to catch quick moves around VWAP. More patient intraday traders may use 30-minute charts for a wider view of the session.
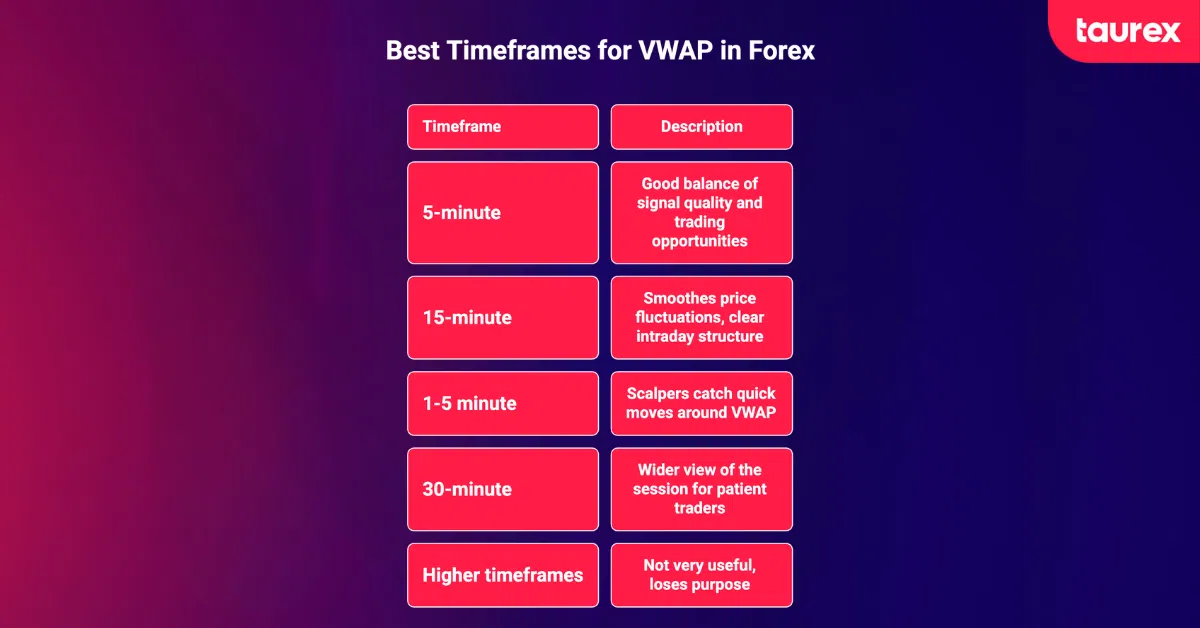
VWAP is not very useful on higher timeframes because it resets each session. On larger charts, it loses its main purpose unless you are using an anchored version of VWAP.
In Forex, it also helps to align VWAP with active trading sessions. Many traders reset it around the London and New York opens, since these periods usually have the highest volume and the cleanest price behavior.
What Are the Limitations of VWAP in Forex Trading?
VWAP has clear limitations in Forex that you should understand before relying on it.
The main issue is the volume of data. Forex is a decentralised over-the-counter market, so there is no single central volume feed across all participants. Instead, brokers use tick volume, which only counts how often the price changes. This means a small trade and a large institutional order are treated the same. Because of this, VWAP is less accurate in Forex than in centralized markets, and different brokers can even show slightly different values.
VWAP also becomes less responsive as the session progresses because it keeps accumulating data. It does not work well in choppy markets where the price keeps moving back and forth across the line.
VWAP should never be used as a standalone indicator. And it works best on liquid major pairs like GBP/USD and USD/JPY, where tick volume is at least dense enough to approximate real activity. On exotic pairs like USD/ZAR or USD/MXN, the sparse tick data makes VWAP signals much less dependable.
5 VWAP Trading Strategies for Forex Traders
This is the practical core of the article. Each of these strategies can be tested on a Taurex demo account before you commit real capital. We strongly recommend backtesting every setup across different market conditions before going live.
VWAP Pullback Strategy
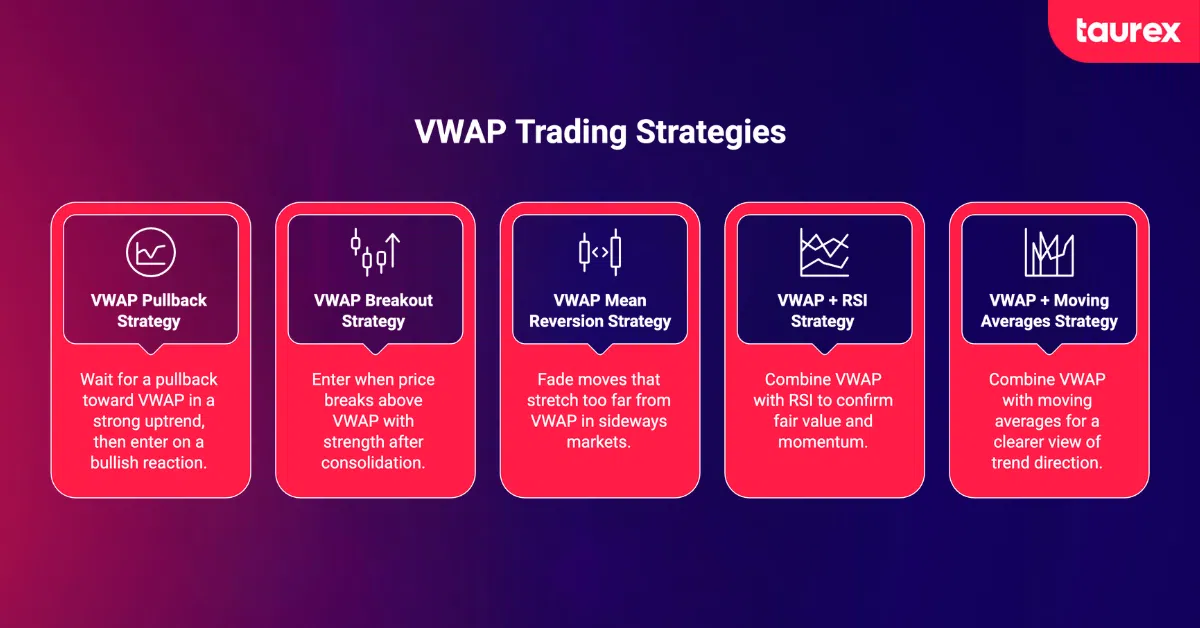
This is one of the most commonly used VWAP trading strategies. It also reflects how institutions often enter the market. In a strong intraday uptrend, the price stays above VWAP, and VWAP moves higher. Instead of chasing price, you wait for a pullback toward VWAP.
The entry happens when the price reaches VWAP and shows a clear bullish reaction. A strong bullish candle that moves back above VWAP is the main signal. Many traders also look for momentum confirmation to avoid weak moves.
A stop is usually placed below the recent swing low or below the lower VWAP band. For exits, traders often take partial profit near the previous session high and let the rest run while trailing below VWAP. You can pair this with a divergence trading strategy for added confirmation.
VWAP Breakout Strategy
This strategy focuses on strong moves that start after consolidation.
When price moves sideways just below VWAP and then breaks above it with strength, it can signal the start of a new trend. The entry is taken when the price closes above VWAP in a single strong candle. Volume should increase compared to recent activity, and momentum should confirm the move.
A stop is usually placed below the most recent small swing low or below the opposite VWAP band. Many traders take partial profit at a 1 to 1 risk to reward level. The remaining position is held as long as the price stays above VWAP and momentum remains strong.
This setup can perform well in trending conditions. However, results can vary, so Forex risk management is still important.
VWAP Mean Reversion Strategy
This VWAP trading strategy is the opposite of the breakout approach. It works best when the market is moving sideways and not trending strongly.
When price moves too far away from VWAP, it often comes back toward it. This usually happens when the price reaches the upper or lower VWAP bands, which show that the move may be stretched.
At these levels, traders look for signs that momentum is fading. This could be a divergence on RSI or a clear reversal candle, such as a strong bearish or bullish rejection.
The trade idea is to fade the move and target a return toward the VWAP line.
However, this strategy does not work well in strong trends. When there is real directional strength, price can stay extended for a long time without reverting to VWAP.
VWAP + RSI Strategy
This strategy combines VWAP with RSI to confirm both fair value and momentum.
For long trades, the price should move above VWAP while RSI stays above 30. This shows that buyers are in control, but the move is not yet overextended. For short trades, price moves below VWAP while RSI stays below 70. This suggests sellers are in control with room for continuation.
Exits can be taken when the price crosses back through VWAP or when RSI reaches overbought or oversold conditions. Most traders use a 14-period RSI, although shorter timeframes sometimes use faster settings for quicker signals.
The main benefit of this strategy is that it helps filter out false VWAP breakouts by confirming whether real momentum is behind the move.
VWAP + Moving Averages Strategy
This strategy combines VWAP with moving averages to get a clearer view of trend direction. VWAP shows the session’s fair value, while moving averages help confirm the broader trend. When both align, signals tend to be more reliable.
For long setups, price stays above VWAP and above key moving averages like the 50 or 200 EMA. After a pullback, the price should hold above these levels and continue moving higher. For short setups, price remains below VWAP and below the moving averages, and any pullback fails to reclaim them.
Entries usually come after a pullback into VWAP that holds in the direction of the trend, which helps avoid chasing price and focuses on continuation instead. Stops are typically placed beyond the EMA or outside the VWAP band, depending on volatility, while exits are taken when the price loses VWAP or when the moving average trend begins to shift.
This combination helps smooth VWAP signals and reduces false trades during choppy market conditions.
Real-Life Example of VWAP Strategy
Imagine a EUR/USD session on a 5-minute chart during the London–New York overlap. Price has been trending higher through the morning and consistently stays above VWAP, showing strong bullish control.
Around 1:30 PM GMT, the price pulls back and touches the VWAP line. RSI drops to around 48 but stays above 30, which suggests momentum is cooling but not reversing. This keeps the bullish structure intact.
At VWAP, the price forms a bullish engulfing candle that closes back above the line. This is the trigger. A trader enters a long position at the close of that candle, placing a stop a few pips below the candle’s low, just under the recent swing low. The target is set at about twice the risk, aligned with the previous session’s high.
Price then continues the uptrend and reaches the target within a few candles. This is a clean example of a VWAP pullback setup, where trend, fair value, momentum, and price reaction all align during an active trading session.
VWAP vs Other Indicators: Key Differences and Use Cases
No indicator works best in isolation. Knowing what the VWAP indicator is good at and where other tools do a better job helps you build a more complete trading toolkit.
VWAP Vs Moving Average (SMA/EMA)
The main difference is that VWAP includes volume, while moving averages only use price. VWAP also resets each session, which makes it mainly useful for intraday trading. In contrast, moving averages like the 50 EMA or 200 EMA cover multiple sessions and are better for showing longer-term trend direction.
In practice, VWAP is often used for timing entries within a session, while moving averages help confirm the overall trend. They are not replacements for each other and work best when used together.
VWAP Vs Bollinger Bands
Bollinger Bands use a moving average in the middle with upper and lower bands based on volatility. VWAP can also be used with similar bands, but it is anchored to session activity instead of price history.
Standard Bollinger Bands work across all timeframes, including higher ones. VWAP is mainly used for intraday trading.
A common approach is to use Bollinger Bands to spot when the price is stretched, then use VWAP as a target level for a possible move back toward fair value.
VWAP Vs Volume Profile
A volume profile shows where most trading activity happened during a session, highlighting key zones like the point of control and value areas. VWAP, on the other hand, gives a single dynamic average price line based on volume and price.
A volume profile is better for identifying important structural zones. VWAP is better for tracking real-time fair value during the session.
When both line up, for example, when VWAP is close to the Point of Control, that area often becomes a stronger level where price may react.
Common Mistakes When Using VWAP in Trading
VWAP can be useful for reading intraday price behavior, but it becomes unreliable when traders treat it as a guaranteed signal. Most VWAP mistakes come from entering too early, ignoring market conditions, or using the indicator without confirmation and proper risk control.
- Entering on the way to VWAP instead of waiting for the price to arrive and show a reaction. Anticipating VWAP as a target is fine; opening a position before the price gets there is premature.
- Treating VWAP as a guaranteed support or resistance level. It is a guide based on probability, and in some sessions, the price will slice through it without hesitation.
- Trading VWAP signals in choppy, low-conviction markets. When price keeps crossing VWAP every few candles with no clear direction, the best trade is no trade at all.
- Relying on VWAP as a standalone indicator. Always pair it with at least one momentum or trend confirmation tool such as RSI, MACD, or an EMA.
- Ignoring session resets. In a 24-hour Forex market, resetting VWAP at the wrong time produces misleading readings. Align resets with the London or New York session opens.
- Applying VWAP to exotic or low-liquidity pairs. Tick volume is too sparse on pairs like EUR/DKK or USD/HUF to generate reliable VWAP signals.
- Forgetting to use stop-loss orders. VWAP is not a safety net, and mean reversion setups in particular can fail badly in trending markets. Always define your risk before entering.
FAQ
What does the VWAP tell you?
VWAP tells you the average price at which a currency pair has been traded during the session, weighted by volume. It shows whether price is currently trading above or below the session’s “fair value,” which makes it useful for gauging trend direction, identifying dynamic support and resistance, and timing intraday entries and exits on Forex pairs.
Is VWAP a leading or lagging indicator?
VWAP is a lagging indicator because it is calculated from past price and volume data. It does not predict future moves on its own. That said, its value grows as the session progresses because the cumulative data becomes more meaningful. Traders often pair it with leading indicators like RSI to improve their entry timing and filter out weak signals.
What is the difference between VWAP and moving average?
The key difference is that VWAP incorporates volume while moving averages (SMA, EMA) use price alone. VWAP resets every trading session, making it strictly an intraday tool. Moving averages carry forward indefinitely across multiple days, making them better suited for identifying longer-term trend direction. VWAP gives more weight to price levels where higher volume occurred.
Which timeframe is best for VWAP in Forex?
The 5-minute and 15-minute timeframes are most commonly recommended for Forex traders using the VWAP indicator. The 5-minute chart provides enough signal frequency for active intraday traders, while the 15-minute chart offers cleaner signals with less noise. Scalpers sometimes use 1-minute charts, though signals are noisier. Avoid applying standard VWAP on timeframes above 1 hour.
Can VWAP be used for swing trading?
Standard VWAP resets every session, so it is not designed for multi-day swing trading. The anchored VWAP indicator, on the other hand, lets you start the calculation from any meaningful point, such as a swing high, a swing low, a major news event, or a key reversal. This makes it applicable for swing trading by providing a volume-weighted average from that specific anchor point forward.
Does VWAP work without volume in Forex?
Forex has no true centralised volume data. Brokers provide tick volume, which counts price changes rather than actual traded dollar amounts. This makes VWAP in Forex less precise than in stocks or futures. It still provides useful directional guidance on major pairs, but it should be treated as a relative benchmark rather than an exact price level.
Choosing a regulated broker like Taurex, with access to reliable data feeds and secure fund protection, helps you make the most of the tools available to you.

