
How to Use Chaikin Oscillator Trading Strategy in Forex Trading
Most Forex indicators focus only on price, but price alone does not always show how strong a move really is. The Chaikin Oscillator adds volume into the picture, helping traders see whether buying or selling pressure is actually behind the price movement.
In this guide, we will break down how the Chaikin Oscillator works, how to read its signals, and how traders can apply it in Forex trading strategies using the tools available through an online trading broker.
What Is the Chaikin Oscillator and How Does It Work?
The Chaikin Oscillator indicator is a momentum indicator that measures changes in money flow rather than just price. It does this by tracking the rate of change of the accumulation/distribution line, which helps show whether buyers or sellers are more active in the market.
In simple terms, it is an indicator built on top of another indicator. It applies a moving average style calculation to the accumulation/distribution line, which itself is based on price and volume behavior. It compares short and longer moving averages of this line to measure momentum in money flow.
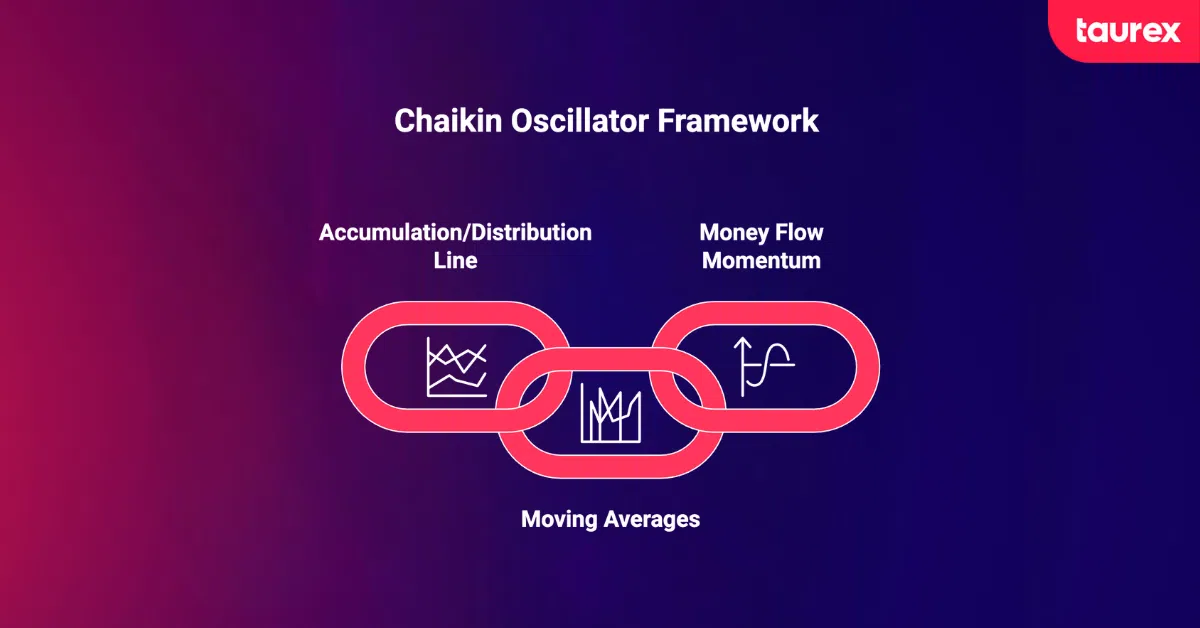
The result is a line that moves above and below the zero level. When it is above zero, it suggests that buying pressure is stronger. When it is below zero, it suggests that selling pressure is stronger.
This is useful in Forex because many common indicators focus only on price and ignore volume. The Chaikin Oscillator uses tick volume as a substitute to help confirm whether a price move has real participation behind it or if it may be weak. It is different from the Chaikin Volatility Indicator, which measures changes in price volatility by analyzing the spread between high and low prices rather than money flow momentum.
Traders can apply it across major Forex pairs on platforms like Taurex to help confirm trends before entering trades.
What Are the Components of the Chaikin Oscillator?
The Chaikin Oscillator is built from two main parts. Once you understand these, the indicator becomes much easier to read and interpret in real trading.
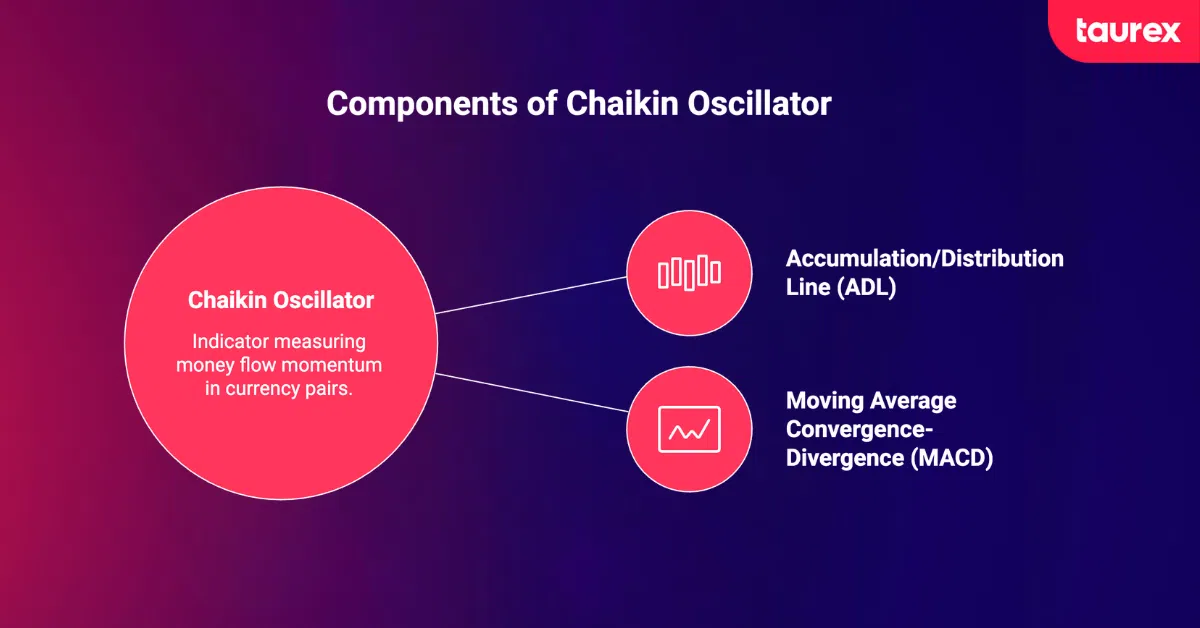
Accumulation/Distribution Line (ADL)
The first part is the Accumulation/Distribution Line, or ADL. It shows whether money is flowing into or out of a currency pair by looking at where the price closes within each candle’s range and combining that with volume.
If the price closes near the top of the candle, it suggests buying pressure and the ADL rises. If it closes near the bottom, it suggests selling pressure, and the ADL falls. Over time, this creates a running total of buying and selling activity.
The second part is the oscillator itself. It takes the ADL and applies a moving-average-style calculation to measure momentum. This is similar in idea to Moving Average Convergence Divergence.
This step turns the ADL into a line that moves above and below zero, helping traders see whether buying or selling pressure is getting stronger or weaker.
How the Oscillator Converts the ADL into a Momentum Signal
This is where the Chaikin Oscillator becomes more interesting. It uses a MACD-style calculation, but instead of applying it to price, it applies it to the Accumulation/Distribution Line.
In most setups, a short-term EMA and a longer-term EMA are calculated on the ADL. The oscillator is then the difference between these two values.
When the faster EMA moves above the slower EMA, the oscillator turns positive. This suggests that buying pressure in money flow is increasing. When the faster EMA moves below the slower one, the oscillator turns negative, suggesting selling pressure is building.
It is important to understand that this is different from a standard MACD based on price. The price-based MACD looks at momentum in price movement, while the Chaikin Oscillator looks at momentum in money flow.
How to Read the Chaikin Oscillator Signals
The Chaikin Oscillator mainly gives two types of signals that traders use to understand changes in buying and selling pressure. Once you know these, the indicator becomes much easier to apply in real trading.
1. Zero-Line Crossovers
A bullish signal happens when the oscillator moves from below zero to above zero. This suggests buying pressure is increasing, and a possible uptrend may start. A bearish signal happens when it moves from above zero to below zero, showing that selling pressure is growing.
These signals can be frequent, especially with default settings, so they are not always reliable on their own. Many traders wait for extra confirmation from price action before entering a trade.
2. Divergence Signals
Divergence is often the more powerful signal. A bullish divergence happens when the price makes a lower low, but the oscillator makes a higher low. This can show that selling pressure is weakening.
A bearish divergence happens when the price makes a higher high, but the oscillator makes a lower high. This can suggest that buying pressure is fading.
Divergence signals can often appear before the price reacts, which may give traders early warning of a potential reversal. However, clearer divergences are usually more reliable than small ones.
How to Calculate the Chaikin Oscillator: The Formula Explained
The Chaikin Oscillator formula uses a few calculation steps, but the idea behind it is simple. It also converts price and volume data into a single momentum line.
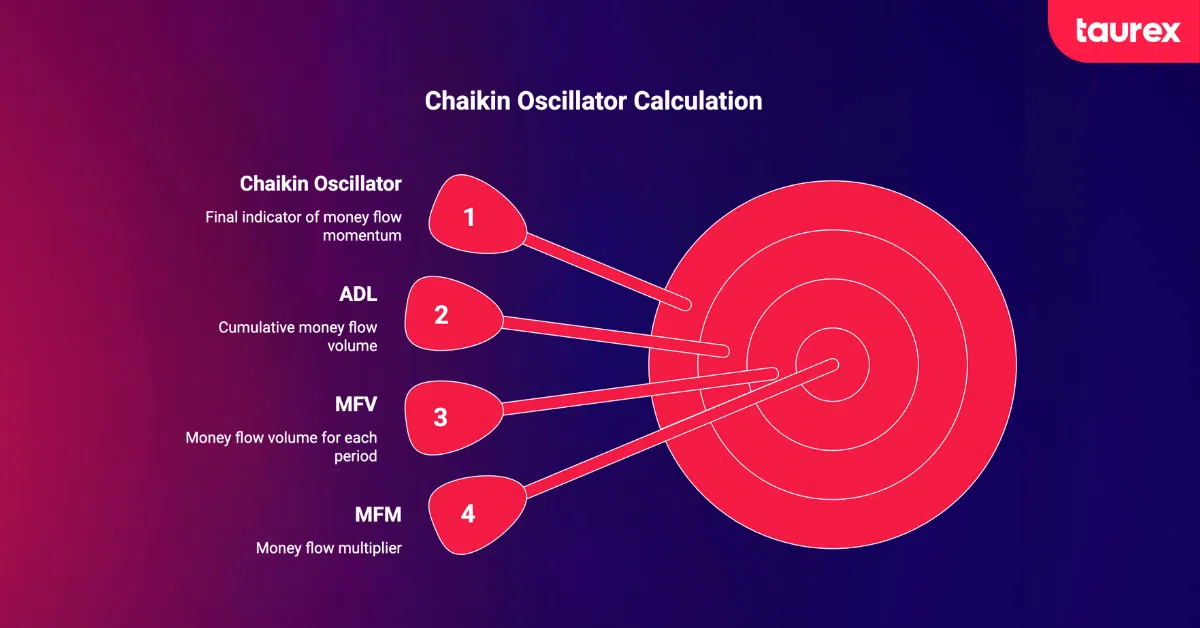
- Step 1: Calculate the Money Flow Multiplier (MFM):
MFM = [(Close − Low) − (High − Close)] / (High − Low) - Step 2: Multiply the MFM by the period’s volume to get the Money Flow Volume (MFV):
MFV = MFM × Volume - Step 3: Build the ADL by adding each period’s MFV to the previous cumulative total:
ADL = Previous ADL + Current MFV - Step 4: Apply the MACD formula to the ADL:
Chaikin Oscillator = 3-day EMA of ADL − 10-day EMA of ADL
The important point is that you do not need to calculate this manually. Forex trading platforms handle everything automatically, so you only focus on interpreting the signals. As noted by EarnForex, the indicator is designed to be used directly without manual computation.
With Taurex, you can apply it easily to analyze money flow and trading signals in real time.
What Are the Chaikin Oscillator Trading Strategies for Forex?
There are a few simple ways traders use the Chaikin Oscillator in Forex. Most strategies focus on confirming trends, spotting reversals, or checking whether breakouts are real.
1. Chaikin Oscillator Trend Confirmation Strategy
This is the most common approach. Traders combine the Chaikin Oscillator with a moving average, like a 50 or 200 EMA.
The rule is simple. If the price is above the EMA and the oscillator is above zero, traders look for buy setups. If the price is below the EMA and the oscillator is below zero, they look for sell setups.
This helps keep trades aligned with the main trend and reduces signals that go against strong market direction. It often works better on higher timeframes like H4 and Daily charts. This setup works well on H4 and daily charts when trading pairs like EUR/USD or GBP/USD.
2. Chaikin Oscillator Divergence Strategy
In this strategy, traders first use divergence trading to compare price movement with the Chaikin Oscillator. Then they wait for confirmation, such as a zero line crossover, before entering a trade.
This extra step helps filter out weaker signals. Stop losses are usually placed beyond recent swing highs or lows, and targets are set near key support or resistance levels.
3. Chaikin Oscillator Breakout Confirmation Strategy
The Chaikin Oscillator can also help confirm breakouts. When price breaks a key support or resistance level, traders check if the oscillator is moving in the same direction.
A rising oscillator above zero during a breakout suggests stronger buying pressure. If price breaks out but the oscillator stays flat or falls, it may signal a weak or false breakout. Breakouts are more reliable when both price and the oscillator move together.
Best Chaikin Oscillator Settings for Forex
The default Chaikin Oscillator setting is (3, 10), which uses a 3-period EMA and a 10-period EMA on the ADL. This setup is more responsive, but it can also create many signals that do not lead to strong moves, especially in choppy Forex conditions.
To reduce noise, traders often use longer settings. Increasing both periods while keeping the same ratio helps smooth the indicator and improve signal quality.
Here is a quick reference by trading style:
- Scalpers (15M to 1H): Stick with (3, 10), but always confirm signals with a second indicator.
- Swing traders (H4 to Daily): Use (6, 20) for cleaner, more actionable crossovers.
- Position traders (Daily to Weekly): Try (10, 50) to reduce whipsaw significantly.
These settings help traders tailor the indicator to their trading style rather than relying on a one-size-fits-all approach. It also helps to consider Forex market hours, since Chaikin Oscillator signals are usually more useful during active sessions with stronger liquidity and cleaner price movement.
It is also important to remember that Forex volume is based on tick data rather than real exchange volume. This means signals can sometimes be less precise. Using smoother settings can help reduce this limitation.
Traders can test different configurations on platforms like Taurex to see how each setting performs across different currency pairs and timeframes.
Chaikin Oscillator vs MACD (and Other Momentum Tools)
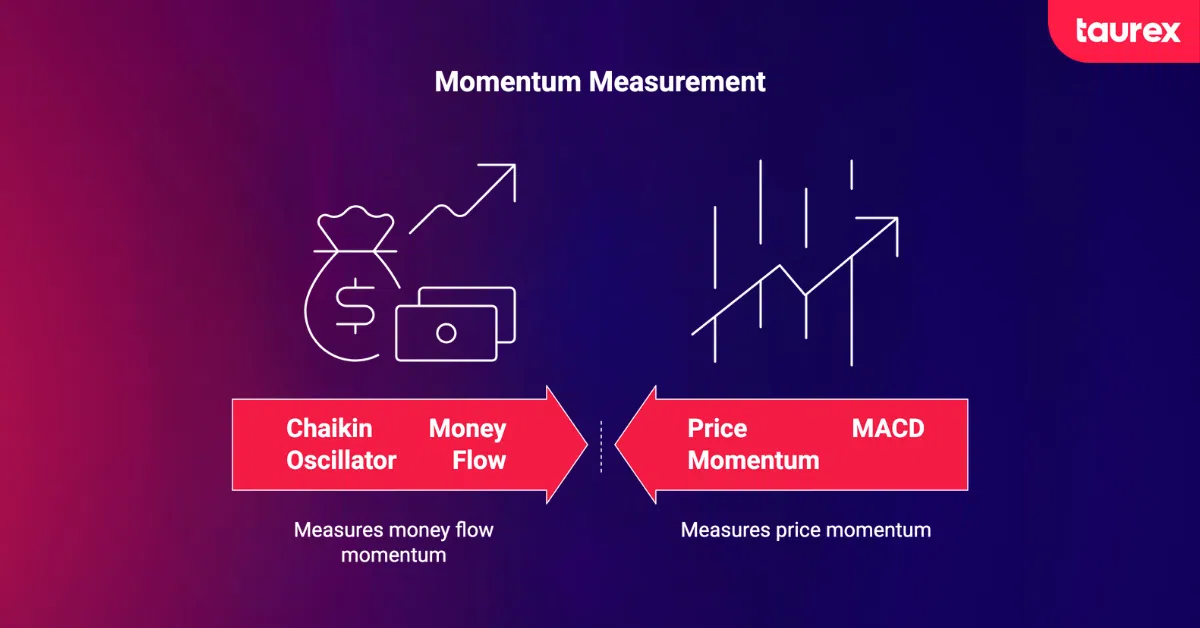
The Chaikin Oscillator and the MACD are built using similar moving average math, but they measure very different things. The moving average convergence divergence focuses on price momentum by comparing two moving averages of price. The Chaikin Oscillator, on the other hand, uses the Accumulation/Distribution Line, so it measures money flow momentum instead of price alone.
In simple terms, MACD tells you how the price is moving, while the Chaikin Oscillator helps you see whether volume is supporting that move.
Compared to the relative strength index, the difference is also important. RSI focuses on how fast and how far the price is moving, mainly to identify overbought or oversold conditions. The Chaikin Oscillator does not do this. Instead, it focuses on whether money is flowing in or out of the market.
Because they measure different things, these tools often work better together than alone. The Chaikin Oscillator should be used as a confirmation tool rather than a standalone system.
In practice, traders often use MACD or RSI for timing and direction, while using the Chaikin Oscillator strategy to confirm whether volume supports the move.
Common Mistakes Traders Make With the Chaikin Oscillator
The Chaikin Oscillator can be very useful, but many traders misuse it in ways that reduce its effectiveness. Understanding these common mistakes can help improve results.
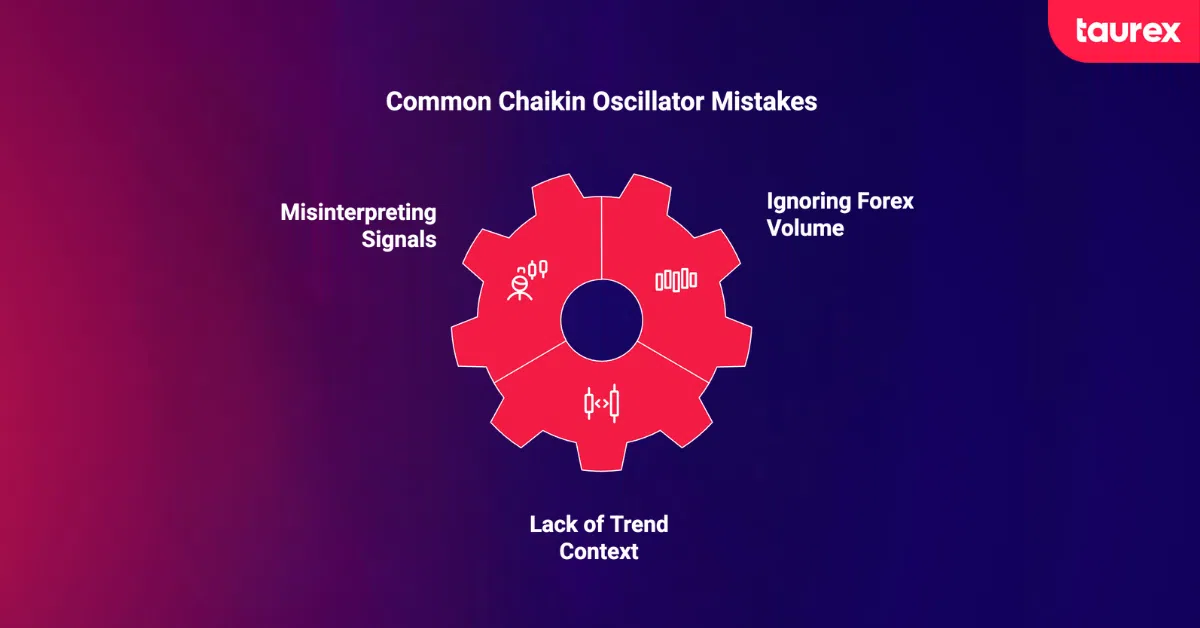
1. Treating It Like RSI or MACD
The Chaikin Oscillator strategy does not work like indicators such as RSI. It does not have fixed overbought or oversold levels, so there are no standard zones like 70 or 30.
It simply measures money flow, not price extremes. Treating it like a traditional momentum or overbought and oversold tool often leads to incorrect signals and confusion.
2. Ignoring Forex Volume Limitations
Forex is a decentralized market, so real volume data is not available. Instead, most platforms use tick volume as an estimate.
While this can still be useful, it is not perfect. Because of this, Chaikin Oscillator signals in Forex are less precise than in markets with real exchange volume. This is why traders often focus on major pairs and use smoother settings along with price confirmation.
3. Trading Without Trend Context
One of the biggest mistakes is using the Chaikin Oscillator without checking the overall trend. In sideways markets, the indicator can move above and below zero repeatedly, creating many false signals.
The Chaikin Oscillator works best in clear trending conditions and can become unreliable in choppy markets.
For this reason, many traders combine it with a trend filter like a moving average or trendline before taking any signals.
How to Combine the Chaikin Oscillator With Other Indicators
The Chaikin Oscillator works best when it is not used alone. When combined with other tools, it gives clearer and more reliable trading signals by adding a money flow perspective to your analysis.
CO + RSI
A common combination is using the Chaikin Oscillator with the Relative Strength Index.
A simple approach is:
- Look for buy signals only when the CO is above zero, and RSI is above 50
- Look for sell signals only when the CO is below zero, and RSI is below 50
This helps filter out weak or low-quality trades by making sure both momentum and money flow agree.
CO + EMA (50 or 200)
Many traders also pair the Chaikin Oscillator trading with a moving average, like the 50 or 200 EMA. The moving average acts as a trend filter.
If the price is above the moving average and the CO is positive, buy signals are stronger. If the price is below the moving average and the CO is negative, sell signals are more reliable.
CO + Bollinger Bands
The Chaikin Oscillator trading strategy can also be combined with Bollinger Bands to add volatility context. When the price reacts from the lower band and the CO is above zero, it may signal buying pressure. When the price rejects the upper band and the CO is below zero, it may suggest selling pressure.
CO + Support/Resistance
Another strong approach is combining CO signals with key price levels. For example, a bullish crossover near a well-tested support level can create a higher confidence entry. The same applies to bearish signals near resistance.
At Taurex, traders can overlay multiple indicators on the same chart, making it easier to build these confirmation-based setups.
Final Thoughts
The Chaikin Oscillator trading strategy gives Forex traders something many indicators miss: volume-based confirmation of momentum. Unlike the Chaikin Volatility Indicator, which measures changes in price volatility through the spread between highs and lows, the Chaikin Oscillator focuses on money flow momentum using the Accumulation/Distribution Line (ADL).
The indicator is not designed to work as a standalone trading system and performs best when combined with price action, trend analysis, or other technical indicators to confirm whether a move is supported by strong market participation.
Although Forex markets rely on tick volume rather than centralized exchange volume, the Chaikin Oscillator can still provide valuable insight on major and highly liquid currency pairs. Its signals tend to become more reliable when traders use proper settings, clear trend context, and additional confirmation tools.
If you want to test the Chaikin volatility indicator in real market conditions without risk, you can open a demo account on Taurex and practice building and refining your trading setups before going live.
FAQ
What does the Chaikin Oscillator measure in Forex trading?
It measures money flow momentum by tracking changes in the Accumulation/Distribution Line. This shows whether buying or selling pressure is building behind price movement. In Forex, tick volume is an estimate of real trading activity.
Is the Chaikin Oscillator a leading or lagging indicator?
It is mainly a lagging indicator because it is based on moving averages. However, divergence signals can appear before the price reacts, which sometimes gives an early warning of possible reversals.
What are the best Chaikin Oscillator settings for Forex?
The most common Chaikin Oscillator settings for Forex are (3, 10), which work well for short-term trading. Swing traders often prefer smoother settings like (6, 20), while longer-term traders may use (10, 50) to reduce market noise and false signals.
What is the difference between the Chaikin Oscillator and the Chaikin Volatility Indicator?
The Chaikin Oscillator and the Chaikin Volatility Indicator are two separate technical indicators created by Marc Chaikin. The Chaikin Oscillator measures money flow momentum by analyzing the Accumulation/Distribution Line (ADL), helping traders identify buying and selling pressure.
In contrast, the Chaikin Volatility Indicator measures changes in market volatility by tracking the spread between high and low prices over a specific period. While the Chaikin Oscillator focuses on momentum and volume flow, the Chaikin Volatility Indicator focuses on price expansion and market volatility.
How reliable is the Chaikin Oscillator for Forex trading?
It is most reliable when used with other tools like trend filters or price action. On its own, it can give false signals, especially in choppy markets where volume data is less precise in Forex.
How do you interpret Chaikin Oscillator divergences?
A bullish divergence happens when the price makes lower lows, but the oscillator makes higher lows, suggesting that selling pressure is weakening. A bearish divergence happens when the price makes higher highs, but the oscillator makes lower highs, suggesting buying pressure is fading.
Does the Chaikin Oscillator work in ranging markets?
It is not very effective in sideways markets. In these conditions, it can move above and below zero frequently without clear follow-through, leading to false signals.
Why is volume important in the Chaikin Oscillator?
Volume helps confirm whether a price move has real strength behind it. The oscillator uses volume to show whether money is flowing into or out of the market, which helps filter weak or unsupported moves.
Can beginners use the Chaikin Oscillator effectively?
Yes, but it is better to start simple. Beginners should focus on zero line crossovers on higher timeframes like H4 or Daily, and combine it with a basic trend indicator such as a moving average. It is best to avoid relying on default settings alone in lower timeframes until you understand how it behaves in different conditions.