

Forex Trend Line Trading Strategy: Breakouts, Setups, and Continuation Trades
Price structure is one of the most important parts of reading a chart, and a simple trend line can often show market direction more clearly than many indicators. The Forex trend line trading strategy is popular because it focuses on natural price movement, such as highs, lows, and overall direction.
Whether you trade major pairs like EUR/USD or more volatile currency pairs, trend lines can help you spot breakout opportunities and trend continuation setups. This guide covers how to draw valid lines, apply proven trendline strategies, and avoid the mistakes that undermine most traders’ results.
What Is a Trend Line in Forex Trading?
A trend line is a straight line drawn on a price chart to show the direction of the market. It connects swing highs in a downtrend or swing lows in an uptrend and helps traders understand where the price is moving over time.
Trend lines also act as dynamic support or resistance, where price often reacts before continuing in the same direction.
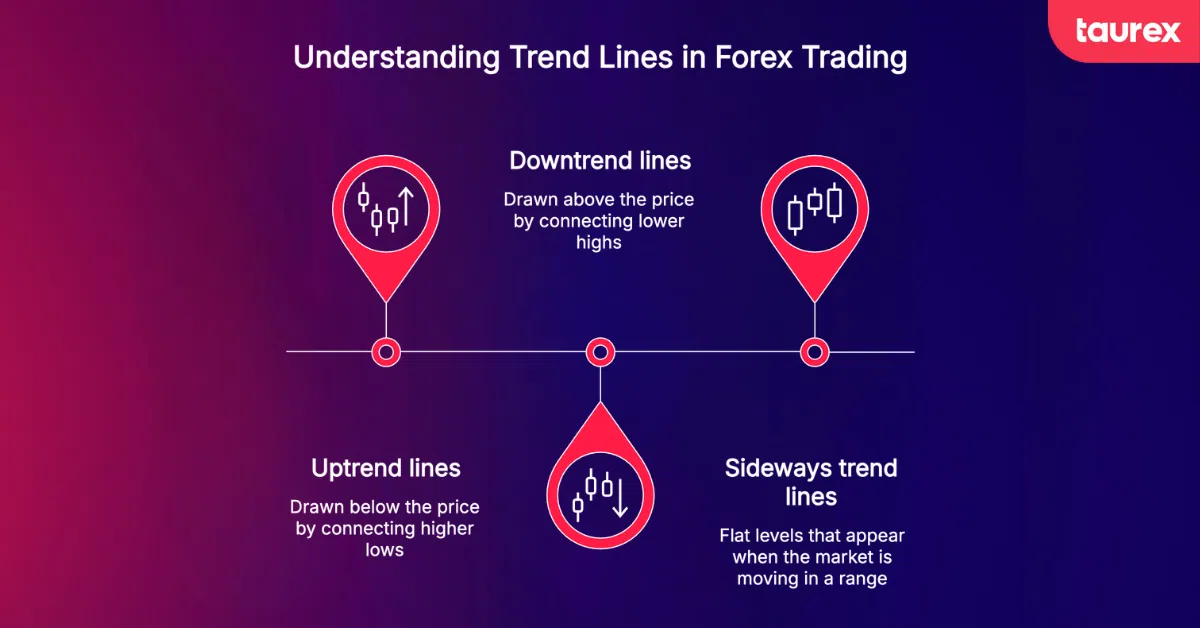
There are three main types of trend lines:
- Uptrend lines: drawn below the price by connecting higher lows and act as support
- Downtrend lines: drawn above the price by connecting lower highs and act as resistance
- Sideways trend lines: flat levels that appear when the market is moving in a range
A trend line strategy in Forex trading can be used on any Forex pair and on any timeframe, from short-term charts to long-term ones. Its effectiveness depends on how clearly the trend lines are drawn and the strength of the trend they are based on.
How Does Trend Line Trading Work in Forex?
Trend line trading is based on how the price interacts with a trend line over time. It helps traders make decisions using three main ideas: entries, breakouts, and risk control.
First, trend lines can highlight entry points when the price pulls back and reacts at the line, often showing a bounce or rejection. Second, they help identify breakouts, where a strong move through the line can signal a possible trend reversal or acceleration. Third, they provide clear reference points for stop loss placement, usually just beyond the trend line or the most recent swing.
In an uptrend, the price often pulls back to the rising trend line and then continues higher. In a downtrend, the price often moves back up to the falling trend line and then continues lower.
On trading platforms like Taurex, traders can easily draw and adjust trend lines on MT4 and MT5 to track market structure and plan trades more precisely.
How to Draw Trend Lines Correctly in Forex Trading
Drawing a trend line correctly turns it into a useful trading tool rather than just a random line on your chart. The key is to follow the price structure, not force your own view onto the market.
Identifying Swing Highs and Swing Lows
A swing high is a point where the price moves up and then reverses down. A swing low is where the price moves down and then reverses up.
In an uptrend, traders connect higher lows to form a rising support line. In a downtrend, they connect lower highs to form a falling resistance line. These swing points are the foundation of every valid trend line.
Drawing Valid Uptrend and Downtrend Lines
Once swing points are identified, draw the line using candle wicks for a more accurate structure. It is important to stay consistent in your approach. Avoid forcing the line through candle bodies, and extend the trend line to the right to see where the price may react in the future.
Very steep trend lines are often unreliable because markets rarely move in a straight vertical direction for long.
Why Multiple Touchpoints Strengthen a Trend Line
A trend line becomes more reliable when the price tests it multiple times. Two touches can define a line, but three or more touches give it stronger validity. The first touch builds the idea, the second confirms it, and the third often provides a higher-quality trading opportunity.
What Are the Best Forex Trend Line Trading Strategies?
Once a valid trend line is in place, it becomes the base for building different trading setups. Below are four of the most common trend line strategies used in Forex trading.

Trend Continuation Strategy
This strategy focuses on trading with the trend. In an uptrend, traders wait for the price to pull back to the trend line and look for a bullish reaction, such as a pin bar or bullish engulfing candle.
In a downtrend, the same idea applies in reverse. Entry is taken after confirmation at the trend line, with a stop loss placed just beyond the line or the recent swing point. The target is usually the next major swing level.
Breakout and Retest Strategy
In this approach, traders wait for the price to break and close beyond the trend line, not just briefly move through it. After the breakout, they wait for the price to return and retest the broken level.
If the trend line holds as new support or resistance, traders enter in the direction of the breakout with a stop placed beyond the retest zone.
Multi-Timeframe Trend Line Strategy
This strategy uses multiple timeframes for better confirmation. Traders draw the main trend line on a higher timeframe, like the daily chart, then look for entries on lower timeframes such as the 4-hour or 1-hour chart.
Trades are only taken when both timeframes agree on direction, which helps reduce false signals and improve trade quality.
Trend Channel Trading Strategy
A trend channel is formed by drawing two parallel trend lines, one acting as support and the other as resistance.
In an uptrend channel, traders look to buy near the lower line and take profits near the upper line. In a downtrend channel, they do the opposite. A strong break outside the channel can also signal a potential breakout trade.
How to Identify Strong vs Weak Trend Lines
Not all trend lines are equally useful. Some are respected by price over and over again, while others break quickly and offer little value. Understanding the difference helps you avoid low-quality setups.
What Makes a Trend Line Reliable?
A strong trend line usually has several clear characteristics. Characteristics of a strong trend line include:
- Three or more clean touches with minimal wick penetration.
- Clear and decisive price reactions at each touch, rather than slow or hesitant movement.
- A moderate slope, usually between 30 and 45 degrees, since very steep trend lines tend to break more easily.
- Alignment with other technical tools, such as key support and resistance levels, Fibonacci retracement levels, or the 50 and 200-period moving averages.
Trend lines become even stronger when they align with other technical tools such as support and resistance zones, Fibonacci levels, or moving averages.
Why Higher Timeframes Create Stronger Trend Lines
Higher timeframes, like the daily and weekly charts, produce cleaner trend lines because they filter out short-term market noise. These levels are also watched by more traders, which can make them more self-reinforcing.
Lower-timeframe trend lines tend to break more often and are better used for timing entries than for defining the main trend.
A common approach is to identify the overall structure on the daily chart, then refine entries on the 4-hour chart for better precision.
What Are the Common Trend Line Trading Mistakes to Avoid?
Even when traders understand how trend lines work, they often make simple mistakes in real trading that reduce their accuracy. Avoiding these errors can make a big difference in results.
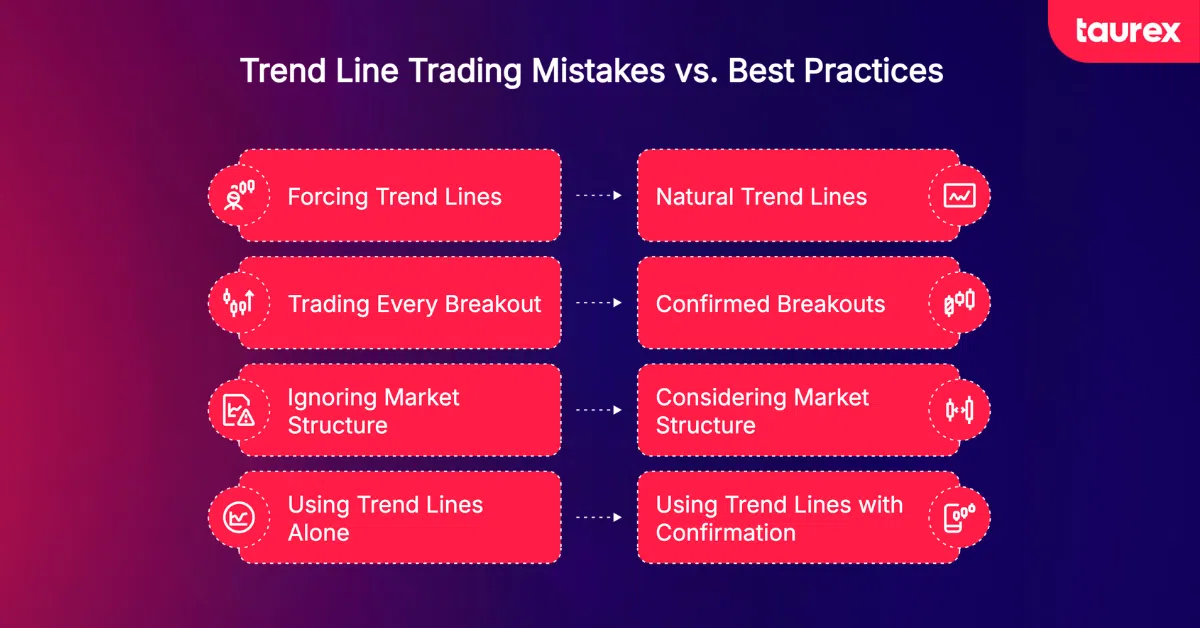
Forcing Trend Lines Onto the Chart
One of the biggest mistakes is forcing a trend line to match a personal bias. If you keep adjusting the line to make it fit the price, it usually means the structure is not valid. A good trend line should be clear and natural based on price movement.
Trading Every Trend Line Breakout
Not every breakout leads to a strong move. In many cases, price briefly breaks a trend line and then reverses. These false breakouts are common during news events or low liquidity sessions.
Waiting for a confirmed candle close beyond the line can help reduce these false signals.
Ignoring Overall Market Structure
Trend lines work best in clearly trending markets. In sideways or choppy conditions, the price can move back and forth through the line repeatedly, leading to poor trades.
Always check the bigger market structure before relying on a trend line setup.
Using Trend Lines Without Confirmation
A touch of a trend line alone is usually not enough to enter a trade. It is better to wait for confirmation, such as a candlestick pattern, RSI signal, MACD crossover, or other supporting evidence.
Stronger setups happen when the trend line aligns with other technical signals, creating a clearer trading decision.
Final Thoughts
Trend lines are one of the most flexible and widely used tools in Forex trading. They are simple to learn, but powerful when applied correctly, especially for understanding market structure and timing entries.
Success with a trend line trading strategy in Forex comes down to three key habits: drawing valid lines based on clear price structure with at least three confirmed touches, waiting for confirmation before entering a trade, and using proper stop loss placement to manage risk.
Both breakout and continuation strategies can work well when used with patience and discipline, but no approach guarantees results. Forex trading always involves risk, and outcomes can vary.
Traders can practise these techniques on Taurex using MT4 and MT5 platforms, demo accounts, and access to a wide range of currency pairs. Building experience on a demo account first can help you develop consistency before trading live markets.
Start building your trading skills today and open a free Taurex demo account to test trend line strategies in real market conditions without risking your capital.
FAQ
What is a trend line in trading?
A trend line in Forex is a diagonal line drawn on a price chart by connecting swing highs in a downtrend or swing lows in an uptrend. It acts as dynamic support or resistance and helps traders understand market direction and potential trading zones. Trend lines can be used across all currency pairs and timeframes.
How do you draw a trend line correctly?
Identify clear swing highs or swing lows and connect them with a straight line. Extend it to the right side of the chart and align it consistently with candlestick wicks. A trend line becomes more reliable after at least three touches.
What is the best Forex trend line trading strategy?
The breakout and retest strategy is often considered the most structured approach because it waits for confirmation before entry. The trend continuation bounce is also effective in strong trending markets. The best strategy depends on market conditions and trading style.
Do trend lines work in Forex trading?
Yes, trend lines work best in trending markets. They are more reliable on higher timeframes like the 4-hour and daily charts, and when confirmed with multiple touches and additional technical signals. Their effectiveness decreases in sideways markets.
How many touchpoints make a valid trend line?
You can draw a trend line with two points, but at least three touchpoints are needed for validation. More touches generally increase the strength and reliability of the level.
What timeframe is best for trend line trading?
The 4-hour and daily charts are generally the most reliable. The daily chart is better for overall direction, while the 4-hour chart helps with timing entries more precisely.
Are trend line breakouts reliable?
Trend line breakouts are more reliable when confirmed by a candle close beyond the line, followed by a successful retest. Without confirmation, false breakouts are common, especially during low liquidity or high-impact news events.
Can beginners use trend line trading strategies?
Yes, trend line trading is beginner-friendly because it relies on a simple price structure rather than complex indicators. Beginners can practise safely using a Taurex demo account before moving to live trading.

