

Many traders mistake a brief pullback for a full trend reversal and close a position just before the move resumes. Three line strike pattern trading strategies are built to solve exactly this problem; they help traders recognise when a trend is pausing rather than turning.
The three line strike is a four-candle continuation signal that can keep traders on the right side of a strong move. Used with confirmation, it offers clear, rule-based entries that fit naturally into a structured Forex trading plan.
This guide explains what the three line strike candlestick pattern is, how to identify it on a chart, and how to apply the most effective trading strategies along with confirmation techniques, common mistakes, and practical ways to trade it on an online trading platform like Taurex.
What Is the Three Line Strike Candlestick Pattern?
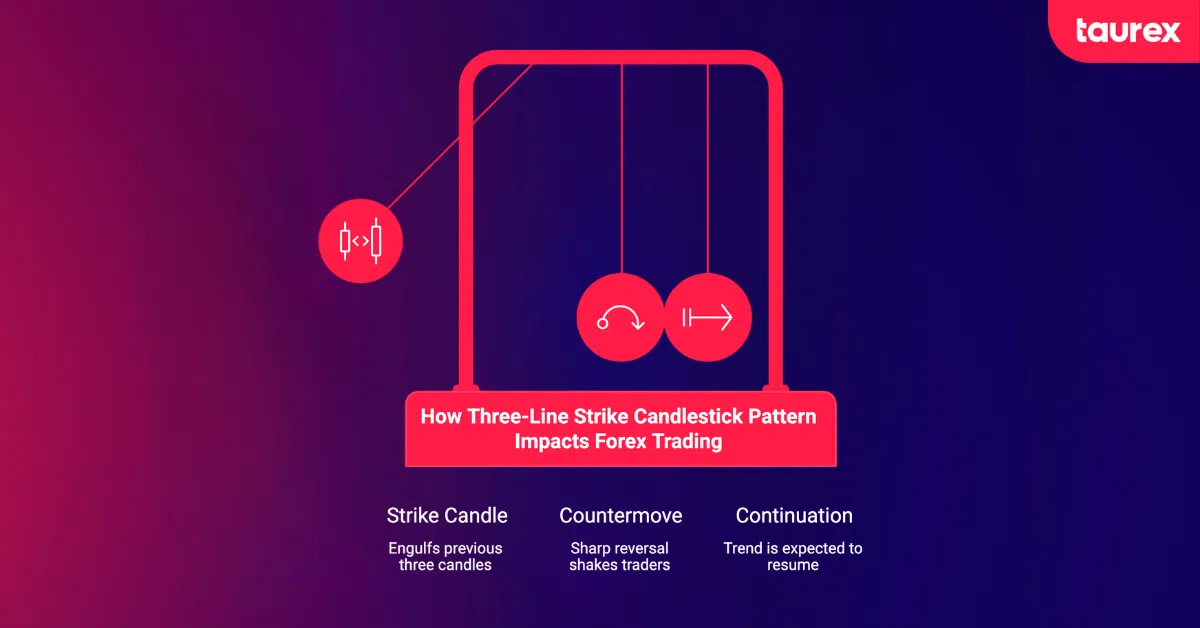
The three-line strike candlestick pattern is a four-candle formation that is typically used as a continuation signal. It begins with three consecutive candles moving in the direction of the current trend, followed by a large fourth candle that completely engulfs the previous three candles.
The fourth candle, known as the “strike” candle, is what makes the pattern stand out. It represents a sharp countermove that often shakes traders out of positions before the broader trend resumes.
While the pattern is generally viewed as a continuation signal, it should not be traded in isolation. Market context and confirmation are important, as the pattern can occasionally appear before a larger reversal.
Bullish three-line strike
The bullish three-line strike forms during an uptrend or after a temporary pullback.
- Three consecutive bearish candles close lower
- A large bullish candle then engulfs all three candles
- The pattern suggests buyers are regaining control, and the uptrend may continue
Many traders look for a long entry after the bullish candle closes and place a stop-loss below its low.
Bearish three-line strike
The bearish three-line strike forms during a downtrend.
- Three consecutive bullish candles close higher
- A large bearish candle then engulfs all three candles
- The pattern suggests sellers are taking back control, and the downtrend may continue
Many traders look for a short entry after the bearish candle closes and place a stop-loss above its high.
How the Three Line Strike Pattern Forms
Understanding each part of the formation helps traders separate a valid setup from a weaker lookalike.
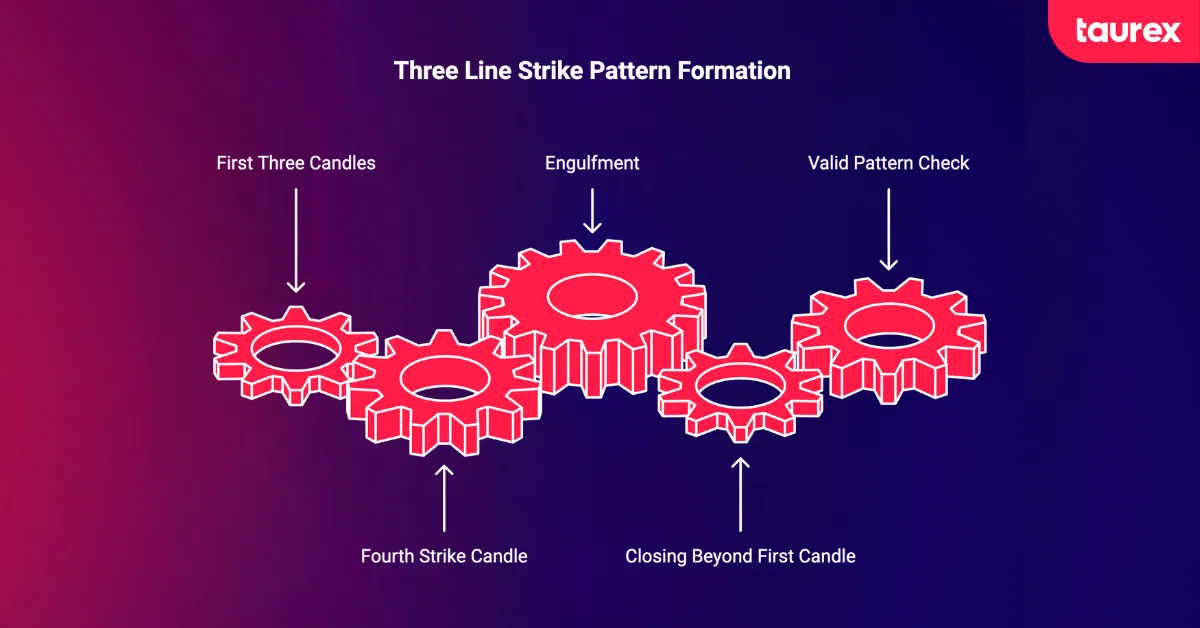
The First Three Candles
The first three candles all move in the same direction as the current trend, either bullish or bearish. They should form a steady sequence, with each candle opening within or close to the body of the previous candle.
A stronger pattern usually has:
- Three candles moving in the same direction
- Similar-sized bodies
- Small wicks showing consistent momentum
- Clear movement within an established trend
Long wicks or uneven candle sizes can suggest weakening momentum and reduce the quality of the setup.
The Fourth Strike Candle
The fourth candle is what defines the pattern. It moves sharply in the opposite direction and completely engulfs the previous three candles.
For a valid setup:
- The fourth candle must engulf all three previous candle bodies
- It should close beyond the open of the first candle
- A larger body generally creates a stronger signal
- Excessively long wicks can weaken the pattern
This dramatic move often causes traders to think the trend is reversing, even though the broader trend may still be intact.
What Makes A Valid Three Line Strike Pattern
Before considering a trade, check that the pattern meets these conditions:
- It forms within a clear uptrend or downtrend
- The first three candles move in the same direction
- The fourth candle fully engulfs all three previous candle bodies
- The fourth candle closes beyond the open of the first candle
- The market is trending rather than moving sideways
The pattern tends to be more reliable on H1, H4, and Daily charts, where market noise is lower.
Common Variations Traders Encounter
Not every pattern looks perfect. Some valid setups may have slightly different-sized candles or small wicks on the fourth candle.
However, if the fourth candle does not fully engulf the previous three candles, it is not a true three-line strike pattern. In that case, it is more likely a standard engulfing pattern rather than a three-line strike. Be aware that a temporarily wide Forex spread during illiquid sessions can inflate candle wicks, making incomplete engulfments appear valid when they are not.
How to Identify a Three Line Strike Pattern on Forex Charts
Identifying a three line strike pattern starts with finding a clear trend and a sequence of three candles moving in the same direction.
When scanning charts, look for:
- Three consecutive candles forming a steady move higher or lower
- A large fourth candle that completely engulfs the previous three candles
- A pattern forming within an established trend rather than a sideways market
- Strong, clean candle bodies with limited signs of indecision
Many traders start on the H4 or Daily chart, where the pattern tends to be more reliable. You can then move to the H1 chart to refine potential entries.
Major Forex pairs such as EUR/USD, GBP/USD, and USD/JPY often produce cleaner setups because of their high liquidity and trading volume. The simplest visual check is to compare the fourth candle with the previous three. If it clearly engulfs them and closes beyond the open of the first candle, the pattern may be valid.
On Taurex, traders can monitor multiple charts and timeframes simultaneously through MT4 and MT5, making it easier to track three line strike setups across several Forex pairs at the same time.
How to Identify a Three Strike Pattern on Forex Charts
The three line strike pattern can be traded in different ways depending on your risk tolerance and overall trading approach. Below are four common strategies traders use to turn the pattern into a practical trading setup.
Trend Continuation Strategy
This is the most direct way to trade the pattern and is based on the idea that the existing trend is likely to continue.
- Confirm the trend using price structure or moving averages
- Enter after the fourth candle closes
- Place a stop-loss below the fourth candle’s low for bullish setups or above its high for bearish setups
- Target the next key resistance level for longs or the support level for shorts
- Consider trailing your stop-loss as the trade moves in your favour
The goal is to join the existing trend and stay in the move for as long as momentum remains intact.
Breakout Confirmation Strategy
This approach prioritises confirmation over early entry.
- Wait for a fifth candle to break above the fourth candle’s high in a bullish setup
- Wait for a fifth candle to break below the fourth candle’s low in a bearish setup
- Enter only after the breakout occurs
This method can reduce false signals, although it often means entering at a less favourable price. Traders who already apply opening range breakout strategies will recognise this logic, waiting for the price to decisively clear a defined level before committing to a direction.
Support and Resistance Strategy
The pattern tends to be more reliable when it forms around important price levels.
- Look for a bullish three-line strike near a strong support zone
- Look for a bearish three-line strike near a resistance zone
- Use the support or resistance level as additional confirmation
When multiple signals align, the setup often carries more weight than the pattern alone.
Multi-Timeframe Confirmation Strategy
This strategy combines lower and higher-timeframe analysis.
- Identify the pattern on H1
- Confirm the broader trend on H4 or Daily
- Look for both timeframes to support the same directional bias
- Avoid trades that go against the higher timeframe trend
On Taurex, traders can analyse multiple timeframes side by side on MT4 and MT5, making it easier to confirm three-line strike setups before entering a trade. Combining this approach with Forex news trading strategies can add another layer of context, particularly when a pattern forms close to a scheduled high-impact release that could accelerate or halt the continuation move.
How to Confirm a Three Line Strike Pattern Before Entering a Trade
The three line strike pattern should not be traded on its own. Using confirmation tools can help filter out weaker setups and improve the quality of your entries.
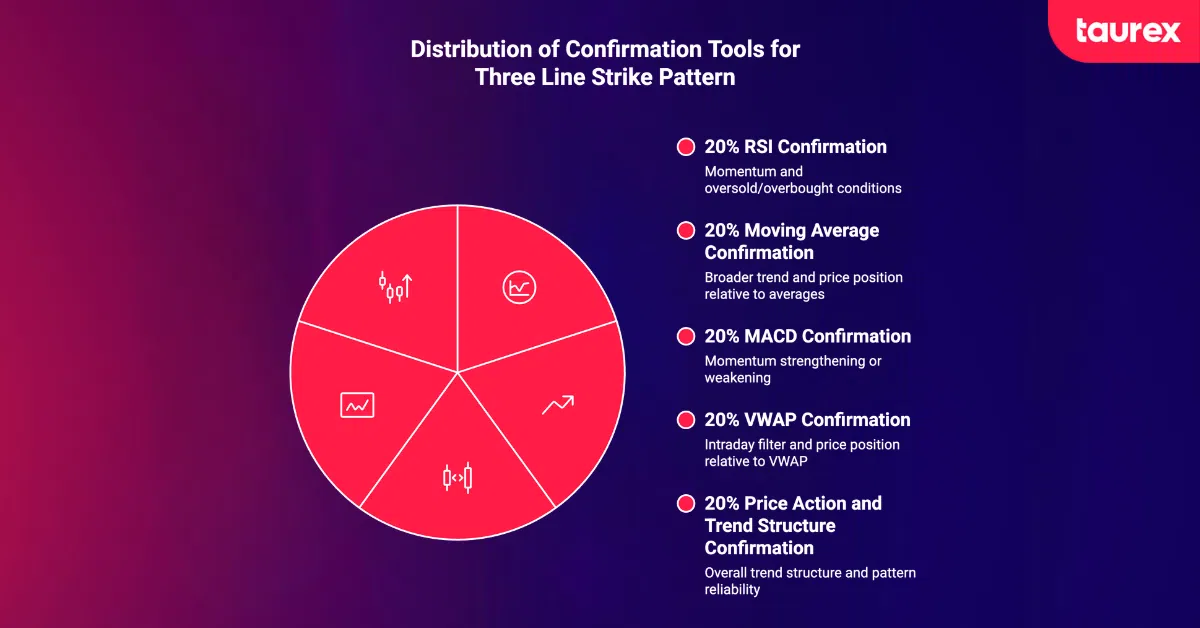
RSI Confirmation
The Relative Strength Index (RSI) can help confirm whether momentum supports the pattern. For a bullish setup, RSI is ideally above 50 or recovering from oversold conditions below 30. For a bearish setup, RSI should be below 50 or moving lower after reaching overbought territory above 70.
Pay attention to divergence as well. If price is moving in one direction while RSI is moving in the opposite direction, momentum may be weakening, and the setup becomes less reliable.
Moving Average Confirmation
Moving averages help confirm the broader trend. Bullish three line strike patterns tend to perform better when the price is trading above key averages such as the 20 EMA or 50 SMA. Bearish setups are generally stronger when the price remains below them.
If the price is moving back and forth around the moving average, the market may be lacking direction. In those conditions, the pattern often loses some of its reliability.
MACD Confirmation
MACD can provide another layer of confirmation by showing whether momentum is strengthening or weakening. For bullish setups, traders often look for the MACD line to cross above the signal line. For bearish setups, the opposite applies.
The histogram can also provide useful clues. Expanding histogram bars suggest momentum is building, while shrinking bars can be an early sign that the move is losing strength.
VWAP Confirmation
The VWAP indicator can serve as a useful intraday filter alongside the three line strike. For bullish setups on shorter timeframes, price holding above the VWAP after the fourth candle closes can suggest that buying pressure is genuine rather than short-lived. For bearish setups, price staying below the VWAP adds weight to the case for downside continuation.
Price Action and Trend Structure Confirmation
Before entering a trade, make sure the overall trend structure still supports the setup. In an uptrend, higher highs and higher lows should remain intact. In a downtrend, lower highs and lower lows should still be visible.
The three-line strike pattern tends to work best when it appears within an established trend rather than after a trend has already become exhausted. If the broader structure has already broken down, the signal becomes much less dependable. Traders who use pullback trading strategies will find the three line strike particularly relevant here, as the fourth candle often mimics a pullback before the original trend resumes, making it a natural trigger for re-entry.
Also consider how price gap trading strategies can complement this confirmation step. When gaps form between the first three candles and the fourth, they can alter the pattern’s structure and signal a more forceful shift in sentiment than a standard close-to-close sequence.
Three Line Strike Pattern vs Other Candlestick Patterns: Which Pattern Is More Reliable?
Several candlestick patterns can look similar to the three line strike, which is why reading candlestick charts correctly is important. Similar formations may look related at first, but they can signal very different market conditions.
Three Line Strike vs Three White Soldiers
Three Line Strike and Three White Soldiers are both bullish patterns, but they signal different market behavior. Three White Soldiers shows strong momentum, while Three Line Strike shows continuation after a pullback.
| Three White Soldiers | Three Line Strike |
| Consists of three consecutive bullish candles. | Consists of three bullish candles followed by a fourth bearish engulfing candle. |
| Signals strong buying momentum and a possible bullish reversal. | Signals a temporary counter-move before the trend potentially resumes. |
| Shows that buyers are gaining control. | Shows that sellers briefly push back, but buyers may still dominate the larger trend. |
| Best used to identify momentum building after a downtrend. | Best used to identify trend continuation after a pullback. |
Three-Line Strike vs Engulfing Pattern
Both patterns use an engulfing candle but differ in structure. The Engulfing Pattern has two candles, while the Three-Line Strike has four and may show a stronger sentiment shift.
| Engulfing Pattern | Three-Line Strike |
| Consists of two candles. | Consists of four candles. |
| The second candle completely engulfs the previous candle. | The fourth candle engulfs the three previous candles. |
| Signals a possible reversal or shift in market direction. | Signals a stronger sentiment shift after a short trend sequence. |
| Easier to identify because it has a simpler structure. | More complex because it needs three candles in one direction, followed by a large engulfing candle. |
Three Line Strike vs Morning Star
Both are multi-candle patterns, but they signal different outcomes. The Morning Star suggests a possible reversal, while the Three Line Strike points to continuation after a short correction.
| Morning Star | Three Line Strike |
| Consists of three candles. | Consists of four candles. |
| Signals a potential reversal from a downtrend to an uptrend. | Signals that the existing trend may continue after a temporary pullback. |
| Used to identify a possible change in trend direction. | Used to confirm continuation of the prevailing trend. |
| Usually appears near the end of a bearish move. | Usually appears within an existing trend. |
Common Mistakes Traders Make When Trading the Three Line Strike Pattern
Even a strong pattern can produce poor results when it is applied in the wrong conditions. Watch out for these common mistakes:
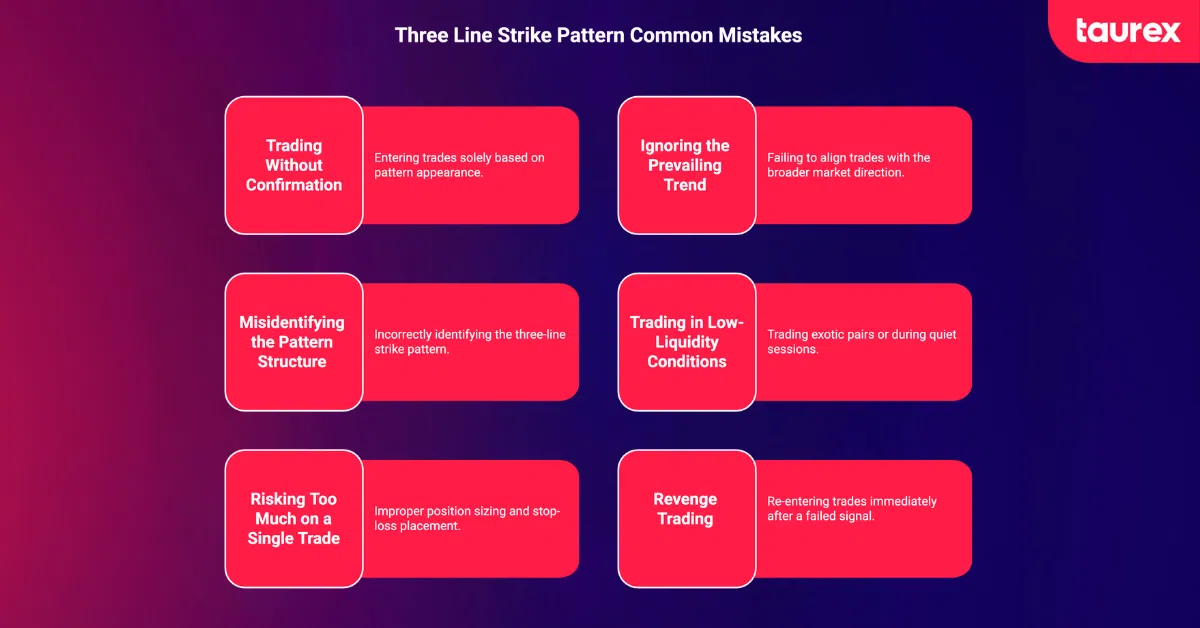
- Trading without confirmation: The pattern alone can produce false signals; look for RSI, MACD, moving averages, or key levels to align first.
- Ignoring the prevailing trend: The strike is more reliable when it agrees with the broader market direction, so always check a higher timeframe.
- Misidentifying the pattern structure: The fourth candle must fully engulf the previous three; partial engulfment does not qualify.
- Trading in low-liquidity conditions: Exotic pairs and quiet sessions produce unreliable price action, focusing on major forex pairs during active forex market hours.
- Risking too much on a single trade: Proper position sizing and stop placement matter regardless of how strong the setup looks. Tracking your forex drawdown across a series of trades helps spot when the strategy is underperforming.
- Revenge trading after a failed signal: Accept the loss and wait for the next valid setup rather than chasing a recovery.
Stick to major pairs during active sessions, and keep an eye on Forex market hours so you are trading when liquidity is deepest.
In Thomas Bulkowski’s candlestick pattern testing, the bearish three-line strike acted as a bullish reversal 84% of the time, but the pattern had a low frequency rank, meaning valid setups can be rare. Since this data is not Forex specific, traders should still confirm the setup with trend structure, RSI, MACD, moving averages, or support and resistance.
Advantages and Limitations of the Three Line Strike Pattern
Like any trading setup, the Three Line Strike has strengths and weaknesses. Understanding both can help you decide when the pattern is worth trading and when extra caution is needed.
| Advantages | Limitations |
| Provides clear, rule-based entry and exit criteria. | Relatively rare on higher timeframes, resulting in fewer trading opportunities. |
| Works across multiple timeframes, from H1 to Daily charts. | Can signal either continuation or reversal depending on market context. |
| Uses four candles, which helps filter out some of the noise seen in simpler patterns. | Requires additional confirmation and analysis before entering a trade. |
| Can be combined with RSI, MACD, moving averages, and support/resistance levels for stronger signals. | Performance tends to weaken in choppy or range-bound markets. |
| Easy to identify once you understand the pattern structure. | Candle size variations can make interpretation more subjective. |
| Offers a structured framework for trend-following traders. | Less common in Forex than some other candlestick patterns, making long-term reliability harder to assess. |
How Traders Test Candlestick Strategies on Forex Trading Platforms
Before trading any candlestick pattern with real capital, it is important to test it across different market conditions. Traders typically start by backtesting the pattern on historical charts to see how it has performed in the past, then move to demo trading to practise identifying setups and managing trades in real time without financial risk.
At Taurex, traders can test patterns such as the Three Line Strike on both MT4 and MT5. With access to historical price data, multiple timeframes, and a wide range of charting and Forex technical analysis tools, it is easy to evaluate how a Forex trading strategy performs before committing real funds.
The demo environment mirrors live market conditions, allowing traders to build confidence, refine their execution, and develop a structured trading approach before transitioning to a live account.
Open a free Taurex demo account today and start testing your three-line strike strategies in real market conditions without risking capital.
FAQ
What is the three-line strike candlestick pattern?
The three-line strike is a four-candlestick pattern made up of three consecutive candles moving in the direction of the prevailing trend, followed by a fourth large candle that fully engulfs all three. It is mainly classified as a continuation pattern, though it can occasionally precede a reversal.
Is the three line strike pattern bullish or bearish?
It can be both. A bullish three-line strike forms when three bearish candles are followed by a large bullish candle, signaling upside continuation. A bearish three-line strike appears when three bullish candles are followed by a large bearish candle, signaling downside continuation.
How reliable is the three line strike pattern in Forex?
The three-line strike pattern is generally more reliable when it forms within an established trend on major Forex pairs. Traders can strengthen the setup by confirming momentum and trend direction with indicators such as RSI, MACD, or moving averages.
What are the best three line strike pattern trading strategies?
The most effective approaches include trend continuation, entering after the fourth candle closes; breakout confirmation, entering after a fifth candle breaks beyond the fourth; support and resistance confluence; and multi-timeframe analysis.
What indicators work best with the three line strike pattern?
RSI for overbought and oversold context, MACD for momentum confirmation, and the 20 or 50 EMA for trend direction are the most commonly used companions to this pattern.
What timeframe is best for trading the three line strike pattern?
H4 and Daily charts produce the most reliable setups in Forex. The pattern does appear on lower timeframes like H1 and M15, but those are more prone to noise. Many experienced traders use H4 or Daily for confirmation and H1 for precise entry.
Does the three-line strike pattern signal a continuation or reversal?
It is primarily a continuation pattern, but it can precede reversals, particularly when it forms at market extremes or alongside overbought or oversold readings. Context and confirmation remain essential.
How is the three line strike pattern different from three white soldiers?
Three White Soldiers is three progressively higher bullish candles that usually signal strong momentum or a fresh uptrend. The three-line strike adds a fourth engulfing candle, representing a brief counter-move before the trend resumes, which makes it a distinct and more complex signal.

