Key Points
- All three assets are in active selloffs following last week’s hawkish FOMC meeting where the dot plot shifted to a 3.8% median year end rate. The NASDAQ 100 has dropped over 1,000 points from its highs, Bitcoin has fallen from $65,200 to $62,292, and gold is pressing toward $4,100. The structure on all three 15 minute charts is firmly bearish.
- The common thread across these setups is the pullback to supply strategy. When price is making lower lows and lower highs on the 15 minute timeframe, the highest probability entries come from waiting for price to retrace into a broken support level (which becomes resistance) before continuing in the trend direction.
- RSI divergence on gold is the exception to watch. Three consecutive Bull divergence signals have printed on the 15 minute chart, suggesting the sellers are losing momentum even as price makes new lows. This sets up a potential reversal scenario if the $4,090 Weak Low holds.
This week’s Trade Radar focuses on three assets that are all reacting to the same macro event: last week’s hawkish FOMC meeting. Kevin Warsh’s first press conference as Fed Chair sent the dollar surging and risk assets tumbling. Today, Starmer’s resignation has added further uncertainty to global markets. All three setups below use the 15 minute timeframe to identify precise entry zones within the broader move. For each idea, the key levels, the invalidation point (where the idea is wrong), and the targets are clearly laid out.
Trade Idea 1: NASDAQ 100 (NAS100)
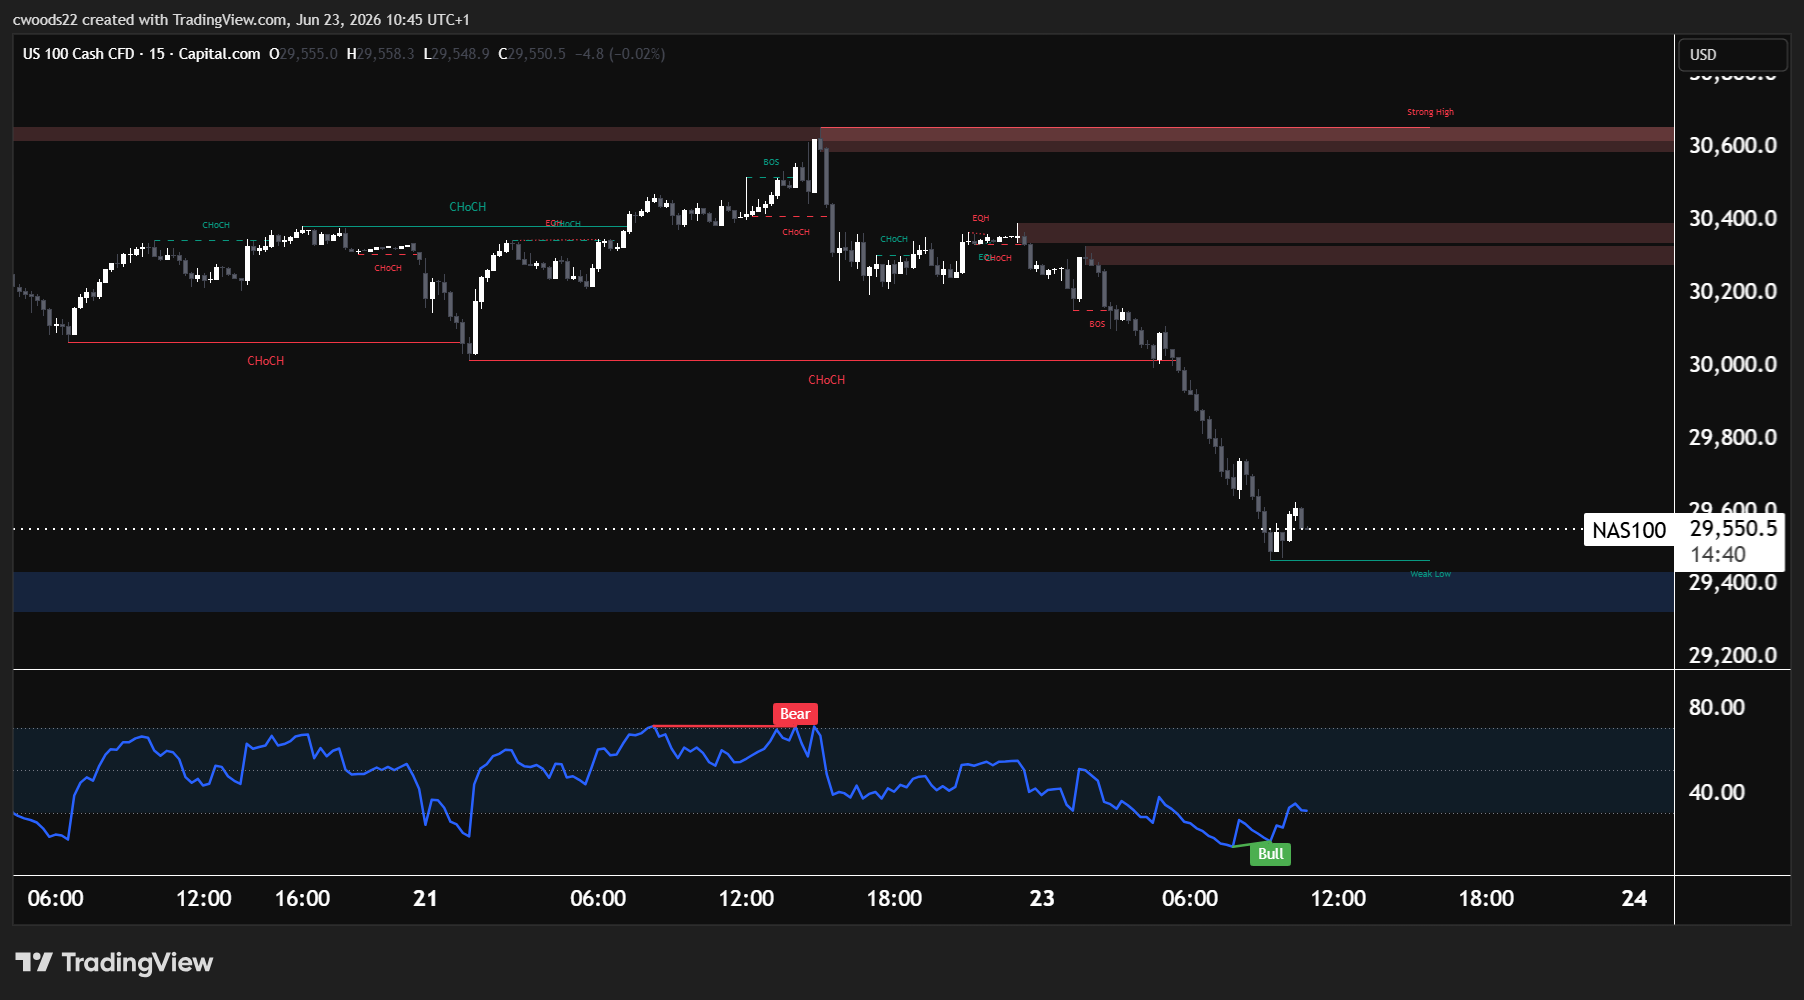
Chart: NAS100, 15-minute timeframe (TradingView, SMC)
| Pair | NAS100 (US 100 Cash CFD) |
| Bias | Bearish |
| Entry Zone | 29,950 to 30,100 (CHoCH retest zone) |
| Invalidation | Above 30,400 (EQH area) |
| Target 1 | 29,400 (Weak Low) |
| Target 2 | 29,200 |
| Risk : Reward | Approx 1 : 2 |
The Setup
The NASDAQ 100 has fallen over 1,000 points from the 30,600 area and sits at 29,550 today. The 15 minute chart shows a textbook bearish structure: a Strong High near 30,650 that was rejected hard, followed by a Change of Character (CHoCH) at 30,000. When price breaks below a key swing low during an uptrend, that is a CHoCH, and it tells us the trend direction has likely shifted from bullish to bearish.
Since the CHoCH, every attempt to bounce has been sold into. Multiple Break of Structure (BOS) confirmations at 30,100 and 29,600 show the sellers are in control. The Weak Low at 29,400, visible as the blue zone at the bottom of the chart, is where liquidity is sitting. In Smart Money terms, the market tends to seek out these liquidity pools, making 29,400 the natural target for this move.
The Plan
Rather than chasing the move lower at 29,550 (which has already extended significantly), traders may consider waiting for a pullback into the 29,950 to 30,100 zone. This area was the CHoCH level and previous support, which now acts as resistance. A rejection from this zone with bearish candle confirmation on the 15 minute chart would offer a higher probability entry. RSI is currently showing a Bull signal at the lows, which suggests a short term bounce toward this area is possible before the next leg lower. The idea is invalidated if price closes above 30,400 on the 15 minute, as that would reclaim the EQH area and shift the structure.
The catalyst to watch is today’s US flash PMI data at 13:45 UTC. A strong reading above 54 on manufacturing could accelerate the dollar bid and push the NASDAQ lower. A weaker reading could trigger the pullback that creates the entry opportunity.
Trade Idea 2: Bitcoin (BTC/USD)
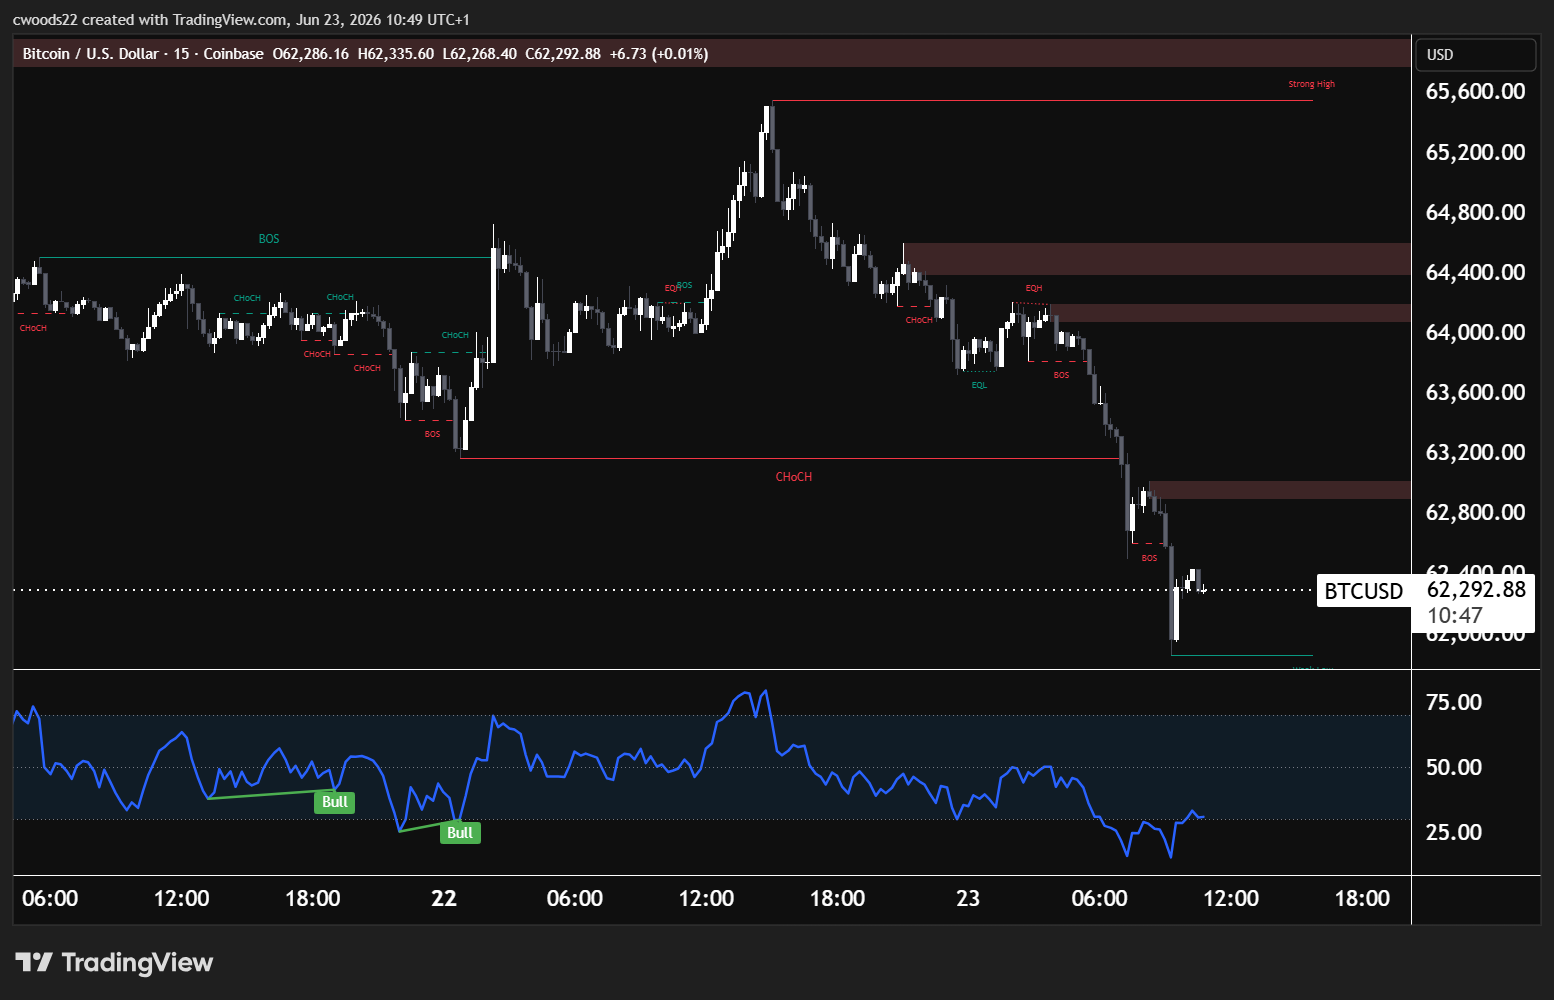
Chart: BTC/USD, 15-minute timeframe (TradingView, SMC)
| Pair | BTC/USD (Coinbase) |
| Bias | Bearish |
| Entry Zone | $62,800 to $63,000 (supply zone retest) |
| Invalidation | Above $63,200 (CHoCH level) |
| Target 1 | $62,000 (Weak Low) |
| Target 2 | $61,500 |
| Risk : Reward | Approx 1 : 2.5 |
The Setup
Bitcoin has fallen nearly $3,000 from the $65,200 high to $62,292 and the 15 minute structure has completely shifted bearish. The Strong High at $65,600 marked the ceiling, and after a period of consolidation between $63,800 and $64,400 (where multiple CHoCH signals were battling it out), the sellers won. The decisive CHoCH at $63,200 was the structural break that confirmed the downtrend.
Since that break, price has driven through BOS at $62,800 and is now sitting just above the Weak Low around $62,000. The RSI is deeply oversold near the 25 level, which means a short term bounce is likely before any continuation lower. This is important because it could create the pullback needed for entry. Retail sentiment shows 64% of traders are long BTC, which from a contrarian perspective supports the bearish thesis. When the majority of retail is positioned one way, price often moves the other direction.
The Plan
The $62,800 to $63,000 supply zone is the key area to watch. This red zone on the chart was where the most recent BOS occurred, and in Smart Money analysis, broken support becomes resistance. Traders may look for price to retrace into this zone and show rejection (a bearish engulfing candle, a pin bar, or a lower timeframe CHoCH back to the downside) before considering a short position. The invalidation sits above $63,200, which is the CHoCH level. If price reclaims that area, the bearish thesis is off the table.
The Weak Low at $62,000 is the first target. In Smart Money terms, a Weak Low is a level that price has not defended strongly, meaning there are stop losses and liquidity resting below it. The market tends to sweep these levels. A move through $62,000 could extend toward $61,500 as the next logical support. Bitcoin remains heavily tied to rate expectations under the new Warsh Fed, and Thursday’s Core PCE data is the next fundamental catalyst that could drive the next major move.
Trade Idea 3: Gold (XAU/USD)
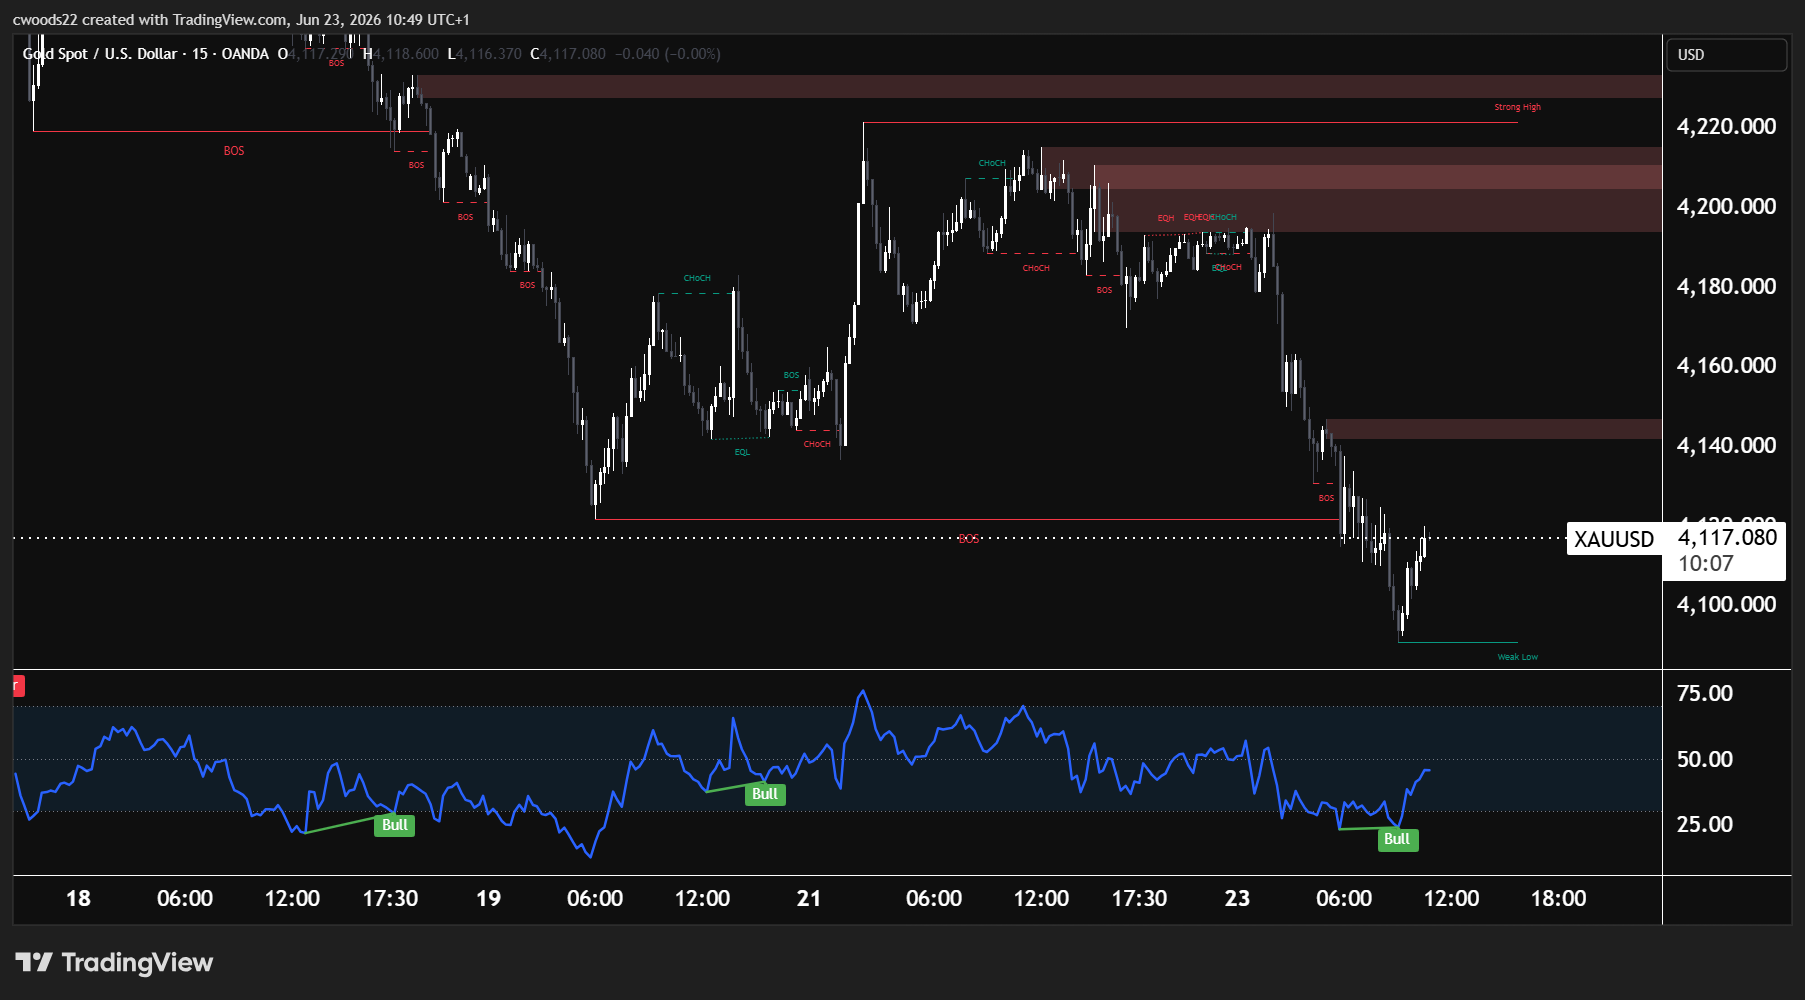
Chart: XAU/USD, 15-minute timeframe (TradingView, SMC)
| Pair | XAU/USD (Gold Spot) |
| Bias | Bearish |
| Entry Zone | $4,130 to $4,145 (supply zone) |
| Invalidation | Above $4,155 (above supply zone) |
| Target 1 | $4,090 (Weak Low) |
| Target 2 | $4,060 |
| Risk : Reward | Approx 1 : 2 |
The Setup
Gold at $4,117 has been in a sustained downtrend on the 15 minute chart since the FOMC decision last Wednesday. The Strong High sits near $4,220 with a large supply zone between $4,190 and $4,210 overhead. From there, price has carved out multiple BOS confirmations on the way down through $4,200, $4,150, and most recently $4,130. The daily technical signal is STRONG SELL with 16 sell signals against zero buys, confirming the broader bearish picture.
What makes this setup particularly interesting is the RSI divergence. Three consecutive Bull divergence signals have printed on the 15 minute RSI (on June 18, June 21, and today June 23). RSI divergence occurs when price makes a lower low but the RSI makes a higher low, suggesting the selling momentum is weakening even as price continues to fall. This does not mean gold will reverse immediately, but it does mean traders should exercise caution with short entries at current levels. Retail sentiment shows 59% of traders are long gold, which again supports the contrarian bearish view.
The Plan
The primary scenario is bearish. The $4,130 to $4,145 supply zone is the immediate overhead resistance where the last BOS occurred. A pullback into this zone that gets rejected would target the Weak Low at $4,090. Below that, $4,060 is the next major demand area from the broader H1 and H4 charts.
However, given the triple RSI divergence, there is an alternative scenario to keep in mind. If price reclaims $4,145 and holds above the supply zone with a strong bullish candle close, it could signal that the divergence is playing out and gold is attempting a reversal. In that case, the next upside target would be the $4,190 to $4,200 EQH area. This alternative scenario is the lower probability one, but the RSI evidence makes it worth acknowledging.
Thursday’s Core PCE is the defining event for gold this week. A hot reading above 0.3% month on month would likely send the dollar higher and push gold through the $4,090 Weak Low. A cooler print below 0.2% could be the catalyst for the RSI divergence to play out and trigger a squeeze back toward $4,190.
Risk Warning: Trading financial instruments, particularly those involving leverage, involves a substantial degree of risk and is not appropriate for all investors. The value of your investments can rise or fall sharply, and it is possible to lose the entirety of your invested capital. Do not trade with funds you cannot afford to lose. Nothing in this site should be read or construed as constituting advice on the part of Taurex or any of its affiliates, directors, officers or employees.