
A currency pair can sometimes rise so quickly that momentum starts to look unstoppable. Traders keep chasing the move, expecting further gains, until buying pressure fades and price reverses sharply.
That sudden surge followed by an abrupt decline is known as a blow-off top pattern. Recognising the warning signs can help traders avoid entering near the end of an overheated rally.
In this guide, we will cover what the pattern is, how to identify it before the reversal, which indicators help confirm it, a step-by-step trade plan, and how it compares with other bearish reversal formations.
What Is a Blow-Off Top Pattern?
A blow-off top is a chart pattern that forms near the final stage of an uptrend. It happens when price rises rapidly, often in a near-vertical move, before reversing sharply as buying pressure fades.
The pattern reflects a point where extreme optimism, aggressive buying and market excitement push price to levels that become difficult to sustain. In Forex trading, a blow-off top may appear on pairs such as EUR/USD after surprise economic data, unexpected central bank commentary, or major news events.

How Does a Blow-Off Top Pattern Form?
A blow-off top usually starts with a strong uptrend that attracts more buyers as price keeps rising. As traders chase the move, buying pressure accelerates and price may climb faster than normal market conditions support.
Eventually, momentum begins to weaken. Early buyers may start taking profit, new buyers become less willing to enter at elevated prices, and selling pressure begins to build. Once sentiment shifts, the reversal can become sharp as more traders exit their positions.
Because the pattern is usually confirmed only after the reversal begins, traders should treat early warning signs as probabilities rather than guarantees.
How to Identify a Blow-Off Top Pattern Before a Reversal
A blow-off top is easier to recognise when several warning signs appear together rather than relying on a single signal. Traders usually look for extreme momentum, signs of exhaustion, and a confirmed break of key levels before treating the pattern as a potential reversal.
Look for a Sharp, Accelerating Price Rally
The first warning sign is an uptrend that starts moving faster than normal. Unlike a steady rally, a blow-off top often shows increasingly larger candles, smaller pullbacks, and a steepening price curve as buyers rush into the market.
These moves often occur near major resistance levels or psychological price areas, where traders may become more willing to chase the final stage of the rally.
Watch for Signs of Extreme Buying Pressure
A blow-off top usually forms when buying activity reaches an unsustainable level. Since Forex does not have a centralised exchange, traders often use tick volume as a proxy to identify unusual increases in market activity.
A sharp rise in tick volume near the highs, combined with wider candle ranges and increased volatility, can suggest that too many buyers are entering late in the move.
Look for Reversal Candlestick Signals Near the Peak
As momentum starts to weaken, price may begin showing rejection near the top. Common warning signs include long upper wicks, Doji candles, Shooting Stars, and bearish engulfing patterns.
These signals do not confirm a reversal by themselves, but they can indicate that buyers are struggling to push price higher. Learning how to read charts properly helps you catch these signals in the moment rather than after the fact.
Confirm the Breakdown Below Support
The final confirmation comes when price breaks below an important support level. This could be a previous swing low, a support zone, or a key moving average.
A single bearish candle is usually not enough. Traders often wait for a clear close below support before considering the blow-off top pattern confirmed.
How to Trade a Blow-Off Top Pattern Step by Step
Recognising a blow-off top is only the first step. A successful trade depends on waiting for confirmation, planning the entry carefully, and managing risk throughout the reversal.
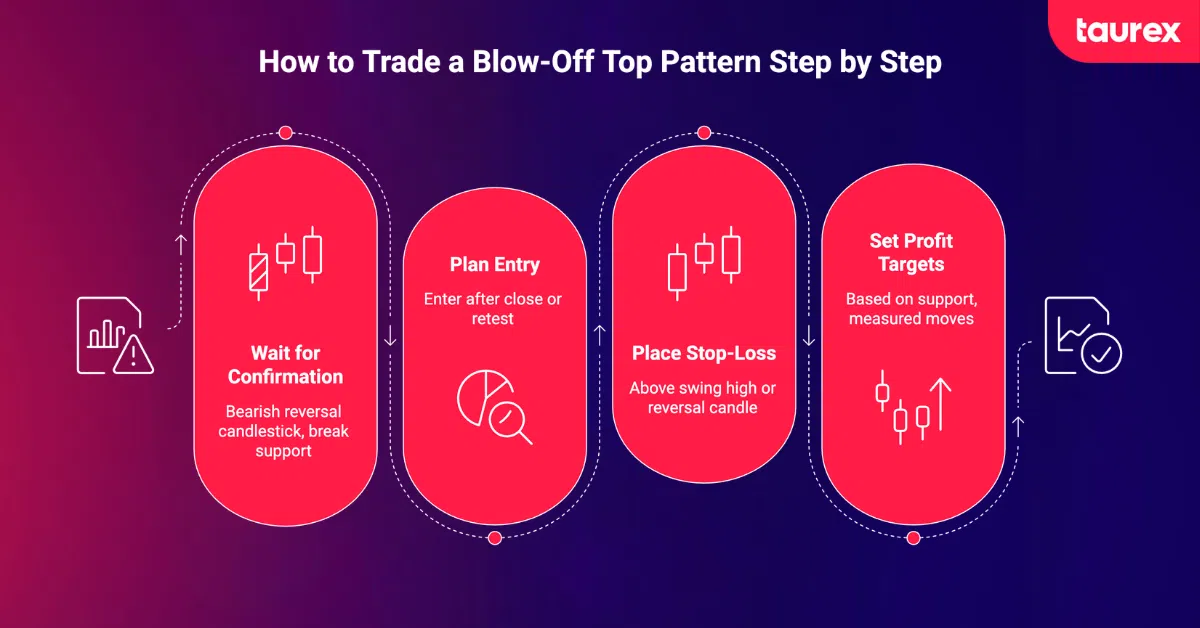
1. Wait for Reversal Confirmation
Avoid shorting simply because price has risen sharply. Instead, wait for clear signs that buyers are losing control, such as a bearish reversal candlestick followed by a break below a key support level or market structure.
Waiting for confirmation reduces the risk of selling into an uptrend that still has momentum.
2. Plan Your Entry
Many traders enter after price closes below support, confirming that the reversal has begun. Others wait for price to retest the broken support level, which may now act as resistance, before entering on a bearish rejection.
The retest approach often provides a more favourable risk-to-reward ratio because it avoids chasing the initial move lower. Understanding the types of Forex orders lets you set these entries with precision.
3. Place Your Stop-Loss
Your stop-loss should sit above the recent swing high or the high of the reversal candle that signalled the entry. Some traders also use the Average True Range (ATR) to add a volatility buffer and reduce the chance of being stopped out by normal price fluctuations.
The stop should always be placed where the trade idea becomes invalid, not at an arbitrary distance.
4. Set Profit Targets
Profit targets are commonly based on previous support levels, measured moves, or Fibonacci retracement levels where price may find buying interest. Many traders also aim for a minimum risk-to-reward ratio of 1:2 before entering the trade.
Planning your exit helps remove emotion and makes it easier to manage the position if volatility increases.
5. Manage Risk Throughout the Trade
Even confirmed blow-off tops can fail, especially during periods of high market volatility. Keep position sizes consistent with your trading plan, monitor major economic events, and consider using a trailing stop to protect profits if the reversal continues.
Forex risk management is what turns a good setup into a sustainable trading strategy over the long term.
| Step | Action | Purpose |
| Confirm | Bearish reversal candle plus a close below support | Avoid shorting into a rally that still has momentum |
| Entry | Close below support, or a retest of support-turned-resistance | A lower-risk entry point |
| Stop-loss | Above the swing high or reversal candle, with an optional ATR buffer | Defines exactly where the idea is invalidated |
| Target | Prior support, measured moves, or Fibonacci zones | Realistic, level-based profit zones |
Which Technical Indicators Help Confirm a Blow-Off Top Pattern?
No single indicator can confirm a blow-off top on its own. Traders often combine momentum, trend, and volume signals to build confidence before acting on a potential reversal.
- Relative Strength Index (RSI): Bearish divergence, where price makes a higher high while RSI forms a lower high, is one of the earliest signs that bullish momentum is fading. However, RSI can remain overbought during strong trends, so it works best alongside other confirmation signals. For a closer look at reading these setups, see our guide to divergence trading strategy.
- MACD: A weakening MACD histogram or bearish divergence can suggest that buying momentum is slowing even if price is still climbing. When MACD and RSI both show weakening momentum, the probability of a reversal increases.
- Volume analysis: Forex traders typically use tick volume rather than exchange volume. A spike in tick volume near the high, followed by lower buying activity or a volume-backed breakdown, can indicate that the rally is running out of strength.
- Moving averages: A close below a key moving average, such as the 20 EMA or 50 EMA, after the rally peaks can provide additional confirmation that the uptrend is losing momentum and a reversal may be underway.
To go deeper on momentum divergence specifically, our divergence trading strategy guide breaks it down in detail. Some traders also combine these signals with Fibonacci retracement levels to identify potential reversal zones and areas where price may react.
A harmonic completion point near a parabolic peak can serve as one more layer of confluence. The two approaches are separate disciplines, but the shared logic is the same: look for confirmation before committing.
Blow-Off Top Pattern vs Other Bearish Reversal Patterns
Blow-off tops can resemble other bearish reversal patterns, but the structure, timing, and confirmation signals are different.
The table below shows the main differences traders should understand before treating a sharp rally as a blow-off top.
| Pattern | Structure | Main Signal |
| Blow-Off Top | Sharp, near-vertical rally followed by a fast reversal | Bullish exhaustion after a climactic price spike |
| Double Top | Two peaks near the same resistance level | Buyers fail twice at the same area |
| Head and Shoulders | Three-peak structure with a higher middle peak | Momentum weakens gradually before breakdown |
| Bear Trap | False breakdown below support before price reverses higher | Sellers are trapped after a failed bearish move |
| Rising Wedge | Price rises inside converging upward trendlines | Momentum weakens as the range narrows |
Common Mistakes Traders Make When Trading Blow-Off Tops
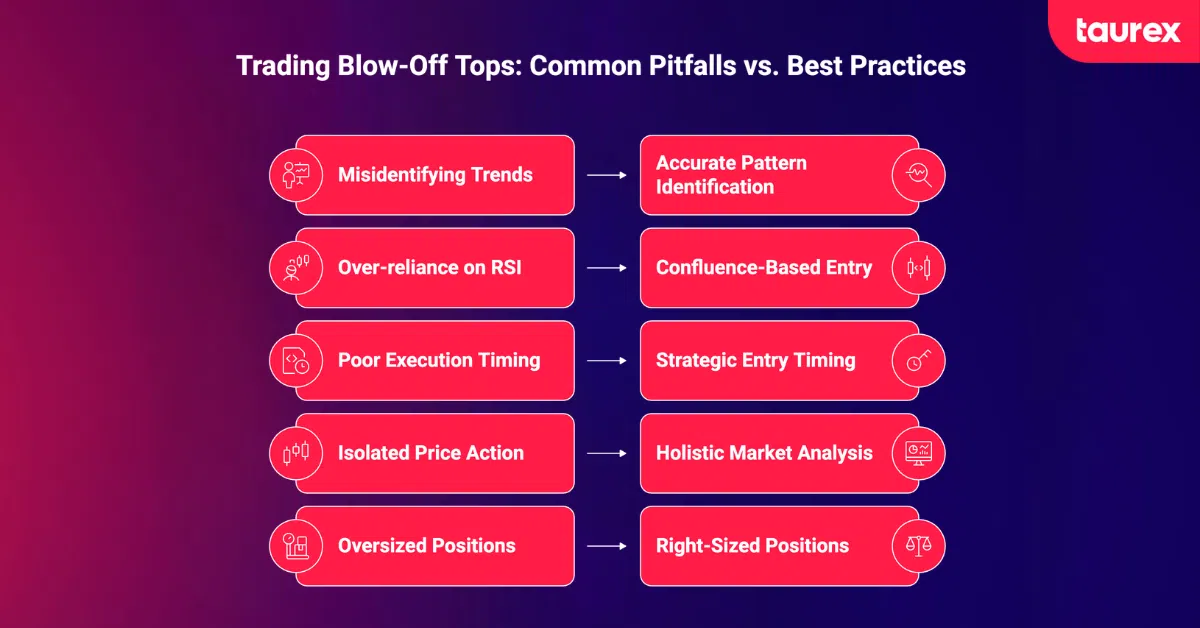
- Mistaking a normal strong uptrend for the pattern: A bull flag or a double top can look similar at a glance, and confusing them leads to premature shorting.
- Shorting on an overbought RSI alone: Without confluence from price structure and volume, an overbought reading on its own is a weak reason to enter.
- Getting the timing wrong: Entering too early before confirmation, or too late after the move has already reversed and retraced, both damage the trade.
- Trading price action alone: Ignoring volume or momentum confirmation removes a layer of evidence you usually want.
- Sizing the position too large: A position that is oversized relative to the volatility of the move exposes you to sharp swings.
Best Practices for Trading Blow-Off Top Patterns
- Wait for multi-signal confluence: Price structure, momentum divergence, volume, and candlestick confirmation should all point the same way before you act.
- Use structure-based stops: Defined stop-losses tied to swing highs work better than arbitrary pip counts.
- Size by account risk: Base your position on a risk percentage, not on how confident you feel.
- Stay aware of scheduled news: Forex blow-offs are so often news-driven, so keep an eye on economic events near the suspected top. Checking Forex market hours helps you anticipate when liquidity and volatility will shift.
- Journal your trades: Keeping a record of your blow-off top trades sharpens your pattern recognition over time.
A regulated platform like Taurex gives traders the advanced charting, technical indicators, and economic calendar tools needed to spot these setups and manage risk with discipline.
Final Thoughts
A blow-off top can offer valuable trading opportunities, but it is also one of the easiest patterns to misread in real time. Rather than trying to pick the exact market top, focus on waiting for confirmation, managing your risk, and following a well-defined trading plan.
Before risking real capital, practise identifying blow-off tops on a demo account and build confidence in your analysis. With Taurex, you can test your trading strategies in a simulated market environment and gain experience without risking real funds.
Remember that trading involves significant risk, and past price patterns do not guarantee future results. A disciplined approach and proper risk management are essential when applying any trading strategy.
Open a demo account today and start practising your Forex strategies in a risk-free environment before trading with real funds.
Trading involves significant risk, including the potential loss of principal. Past performance does not guarantee future results. The value of investments may fluctuate, and you may receive back less than your original investment. This content is educational and does not constitute financial advice.
FAQ
What is a blow-off top?
A blow-off top is a bearish reversal pattern marked by a rapid, near-vertical price surge on climactic momentum, followed by a sharp reversal. It signals that an uptrend has exhausted itself as speculative buying gives way to panic selling.
Is a blow-off top pattern bearish?
Yes. It is a bearish reversal signal that appears after a bullish exhaustion move, typically leading to a swift decline once buyers are spent.
How do you identify a blow-off top pattern?
Look for a sharp accelerating rally, a climactic spike in tick volume, rejection candlesticks near the high such as a Doji or Shooting Star, and a decisive close below a prior support level or key moving average.
Which indicators work best with a blow-off top pattern?
RSI divergence, a contracting MACD histogram, tick-volume analysis, and a break below a 20 or 50 EMA are the most commonly used confirmations. They work best together rather than in isolation.
What causes a blow-off top in Forex?
Speculative FOMO buying drives the initial parabolic push, and in Forex specifically, surprise news or economic data releases often trigger both the climax and the reversal that follows.
How is a blow-off top different from a double top?
A blow-off top is a single parabolic spike with no second test of the high, while a double top involves two distinct tests of the same resistance level over a longer period.
Can beginners trade a blow-off top pattern?
Yes, but with caution. Starting on a demo account and focusing on confirmation and risk management is wiser than trying to pick the exact top. Learning how to open a Forex trading account is an important first step.
Which timeframe is best for spotting a blow-off top?
Higher timeframes like H4 and Daily tend to produce more reliable setups, while lower timeframes are useful for fine-tuning entry once the pattern is confirmed on the higher chart.
How do you confirm a blow-off top reversal?
Confirmation comes from a decisive close below support or a key moving average, alongside a rejection candle at the high and momentum divergence on RSI or MACD.
What happens after a blow-off top pattern?
A sharp decline typically follows as speculative buyers exit and profit-takers or short sellers take control. The reversal is often far quicker and steeper than an ordinary pullback, which is exactly why disciplined risk management matters so much.