Key Points
- Gold sits at $4,182, down sharply from August’s $4,700 high and now trading inside the $4,107 to $4,153 demand zone. This is the level that decides whether the broader uptrend from 2025 survives into the final quarter of the year.
- The US 30 year Treasury yield has climbed to 5.626%, its highest level on the chart, after a steep acceleration through September. That move is the single biggest driver behind gold’s reversal and is worth tracking in its own right this month.
- October closes with a genuine collision of central banks: the RBNZ, the Fed, the Bank of Canada, the ECB, and the Bank of Japan all decide policy within a four day window from the 27th to the 30th, alongside US CPI on the 14th.
September in Review
September delivered on the promise of the central bank calendar previewed in last month’s edition, and the Fed was the headline act. The FOMC raised rates 25bp to a target range of 3.75% to 4.00% on the 16th, the first hike since 2023, with Chair Warsh framing the move as “removing accommodation” rather than tightening and pushing for a faster pace than most of the committee appears to share. The dot plot moved up with it, and two year yields jumped to 4.75% in the aftermath, a reaction some desks have since called an overshoot.
The Fed was not the only central bank in motion. The Bank of Japan hiked to 1.25% on the 18th, a 31 year high, yet the yen fell anyway as Governor Ueda’s accompanying tone read as dovish, keeping the carry trade dynamic behind USD/JPY’s strength firmly intact. The ECB, by contrast, held at 2.65% on the 10th, exactly as forecast and largely a non-event for the euro. The RBA added a fourth data point late in the month, hiking to 4.60% on the 30th, its highest cash rate since November 2011.
The month’s other major swing factor was oil. Escalating US-Iran tensions around the Strait of Hormuz pushed crude above $100 a barrel on the 10th, stoking inflation fears just ahead of the August CPI release the following day. That print came in exactly in line with forecast, 3.4% headline and 2.4% core year on year, and as oil eased back from its spike equities staged a sharp relief rally, with the Dow gaining 400 to 500 points and the S&P 500 and Nasdaq posting similar percentage gains. The Iran and Hormuz situation remains unresolved heading into October and is covered again below.
Gold was the clearest casualty of all this cross-currents. Having closed August near $4,430, it pushed to a fresh high above $4,400 mid-month before breaking down hard into the 27th on the back of the Fed hike and the broader move higher in yields, falling to a low near $4,120. A partial recovery into month end ran into resistance, leaving gold at $4,182 as October opens. The dollar stayed broadly bid through all of this, extending EUR/USD’s decline and keeping USD/JPY pressed up near its highs despite the BOJ hike.
Gold: Testing the Foundation of the 2025 Advance
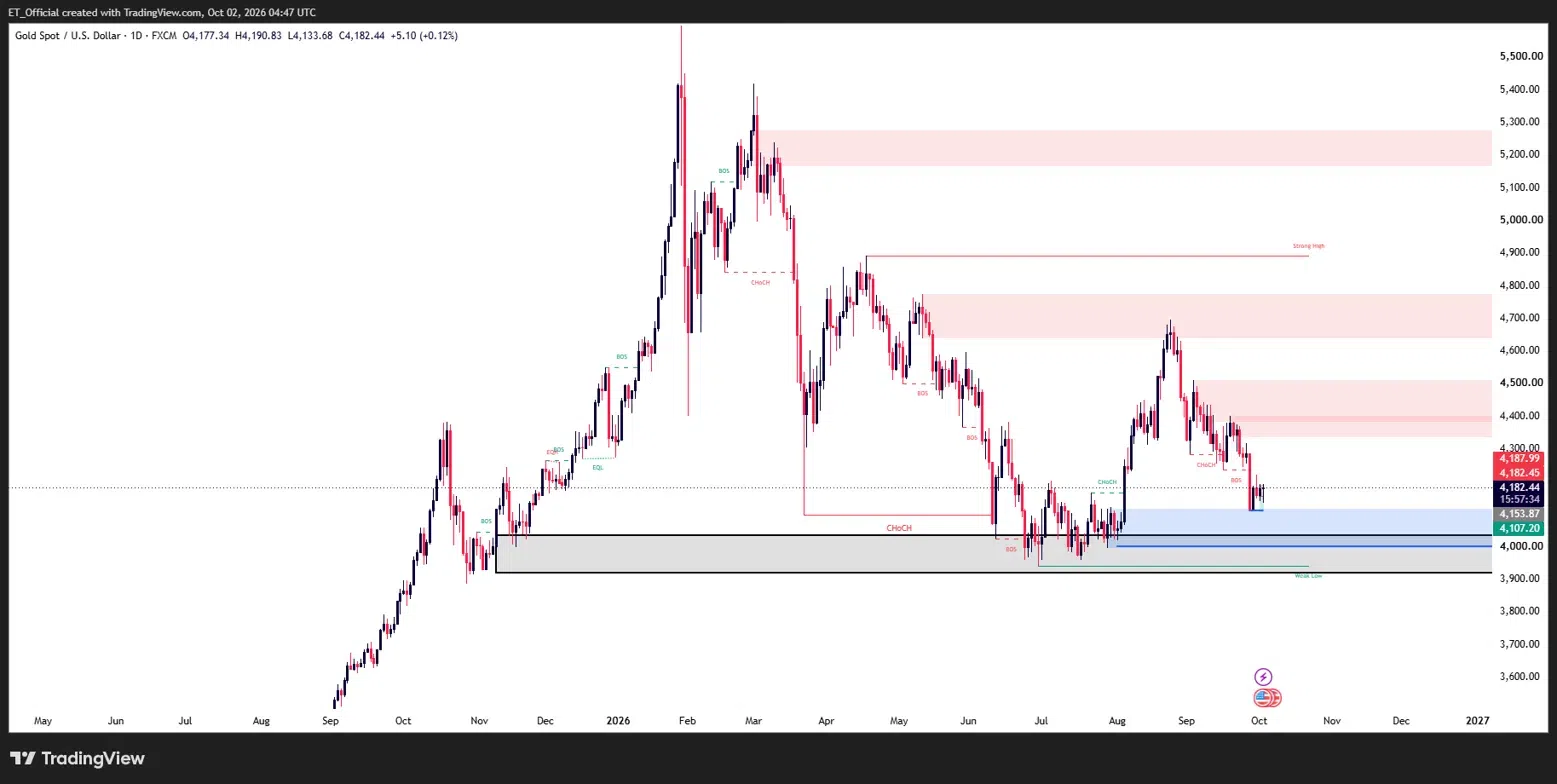
Chart: Gold (XAU/USD), Daily timeframe (TradingView, SMC)
Gold (XAU/USD) daily chart, September 2025 to October 2026: gold peaked above $5,400 in February 2026, corrected to a low near $4,000 by mid-2026, rallied to $4,700 in August, and has since fallen back to $4,182 inside the $4,107 to $4,153 demand zone.
Zoomed out on the daily chart, the scale of the last year is clear. Gold’s advance ran all the way to a high above $5,400 in February 2026 before a sharp correction carried price back down to a low near $4,000 by the middle of the year. From that low, gold rebuilt toward a fresh high near $4,700 in August, a move that has now partially unwound, with price back at $4,182, sitting just above the $4,107 to $4,153 zone that has acted as demand on this pullback.
This zone is the one that matters most for October. A hold here would suggest the pullback from the August high is a correction within a longer term uptrend rather than the start of something deeper. A clean break below it would put the broader structural low near $4,000 back in play, a level that has not been seriously tested since gold first rebuilt off it earlier in the year.
The fundamental picture is the same one driving every other asset this month: gold’s path depends on whether the 30 year yield’s climb to 5.626% continues, stalls, or reverses. With four central bank decisions landing in the last week of October, that question is unlikely to be answered quietly.
The 30 Year Yield: The Move Behind the Month
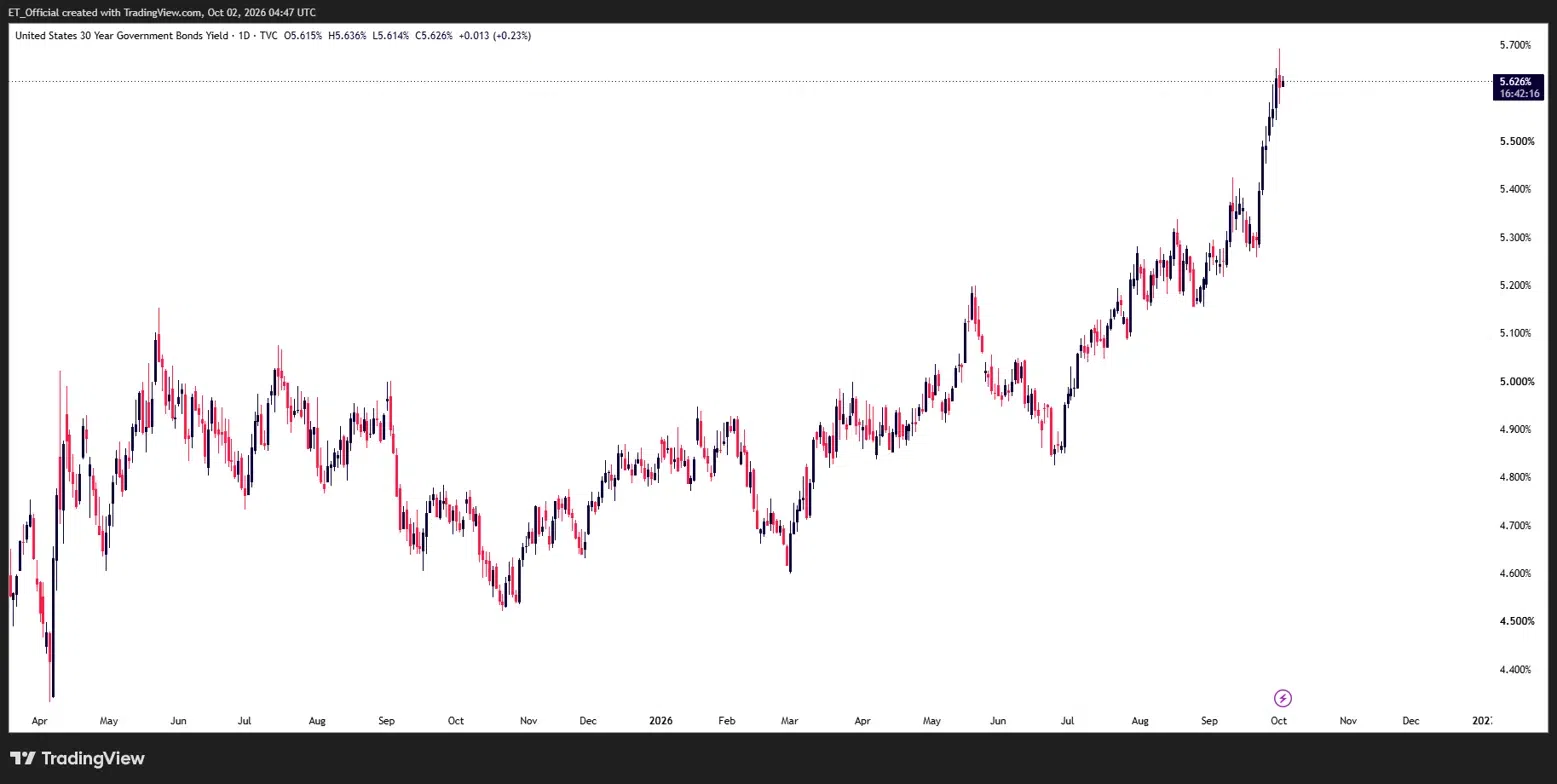
Chart: United States 30 Year Government Bond Yield, Daily timeframe (TradingView)
US 30 year Treasury yield daily chart, April 2026 to October 2026: the yield climbed from a low near 4.40% in April to 5.626% by early October, the highest level on the chart, with the steepest leg of the move coming through September.
This chart is left deliberately unannotated. The 30 year yield is not a trade in the way gold or a currency pair is, but its direction has been the single biggest input into how every other asset in this report has traded, so it is worth looking at in its own right rather than folding it into the gold discussion alone.
The climb has been steady rather than sudden. From a low near 4.40% in April, the yield spent the following months grinding higher through a choppy 4.6% to 5.0% range before breaking out decisively over the summer. That move accelerated through September, carrying the yield to its current 5.626%, the highest level on this chart and a level not seen in close to two decades.
The driver has been a combination of sticky inflation data, a Fed that has leaned hawkish since Chair Warsh’s Jackson Hole address, and fiscal concerns around Treasury issuance. Whether that climb continues, consolidates, or finally reverses is arguably the single most important question for markets this month, with the Fed’s own decision on the 28th, alongside US CPI on the 14th, the two most direct tests of that path.
What to Watch in October
A quick guide to every major event this month and what it could mean for markets.
ISM Manufacturing PMI (Thursday 1 October)
The month’s first major US data point and an early read on whether elevated yields are starting to weigh on activity. A soft print would add to the case for the labour market cooling further; a resilient one would support the hawkish side of the Fed debate.
US Non Farm Payrolls (Friday 2 October)
September’s jobs report, the key release of the first week of the month. By the time this edition is read, the number will already be known; see the Key Dates table below for what was forecast and previous going into the release.
FOMC Minutes (Wednesday 7 October)
The minutes from the September meeting, offering a more detailed look at how divided the committee is on the case for a further hike before year end, and how seriously Kashkari’s one-more-hike view is shared around the table.
US CPI and the Fed’s Beige Book (Wednesday 14 October)
September’s inflation print lands two weeks before the Fed’s own decision, making it the last major data point policymakers see before they have to act. A hot reading would reinforce the case for a further hike and keep the 30 year yield’s climb intact; a softer print would be the first real opportunity for yields, and gold, to reverse course. The Beige Book, released the same day, adds regional colour to the picture.
PBoC Loan Prime Rate (Monday 19 October)
China’s benchmark lending rate decision, worth watching for any signal on stimulus given the broader global growth backdrop and its knock-on effects for commodity demand, gold included.
The Iran and Hormuz Question
The geopolitical risk premium that built through September has not gone away. Any further escalation around the Strait of Hormuz would add fresh upward pressure on oil and a renewed safe-haven bid for gold; a cooling of tensions could see that premium unwind quickly. This remains the biggest wildcard on the calendar, independent of the scheduled data.
RBNZ Official Cash Rate (Tuesday 27 October)
The first of four major central bank decisions inside a four day window. The accompanying statement will matter as much as the headline decision for NZD pairs, which have been caught in the broader dollar strength move through September.
FOMC and Bank of Canada Rate Decisions (Wednesday 28 October)
The single biggest event of the month. This is the Fed’s first full decision since Chair Warsh’s hawkish tone took hold through August and September, complete with updated projections. Whether the committee delivers the hike Kashkari has pencilled in, or holds while leaving the door open, will set the direction for the dollar, gold, and the 30 year yield into year end. The Bank of Canada decides policy the same day.
ECB Rate Decision (Thursday 29 October)
Landing the day after the Fed, the ECB’s decision will be read directly against whatever the Fed just delivered, with the policy gap between the two the key driver for EUR/USD into month end.
Bank of Japan Rate Decision (Friday 30 October)
The last of the month’s central bank cluster, and the most direct test of the carry trade dynamic that has kept USD/JPY pressed up near its recent highs. A hike, or even hawkish commentary, would work against that dynamic; a hold with no fresh guidance would likely let the trend continue.
Key Dates
All times shown in UTC.
| Date | Time (UTC) | Event | Detail |
| Thu 1 Oct | 14:00 | ISM Manufacturing PMI (USD) | First data point of the month |
| Fri 2 Oct | 12:30 | Non Farm Payrolls (USD) | Forecast 70K, previous 162K |
| Wed 7 Oct | 18:00 | FOMC Minutes (USD) | From the September meeting |
| Wed 14 Oct | 12:30 | CPI (September data) (USD) | Last major print before the Fed |
| Wed 14 Oct | 18:00 | Fed Beige Book (USD) | Regional economic colour |
| Mon 19 Oct | 01:15 | PBoC Loan Prime Rate (CNY) | Watch for stimulus signals |
| Tue 27 Oct | 01:00 | RBNZ Rate Decision (NZD) | First of four central banks this week |
| Wed 28 Oct | 18:00 | FOMC Rate Decision (USD) | Updated projections |
| Wed 28 Oct | 13:45 | BOC Rate Decision (CAD) | Same day as the Fed |
| Thu 29 Oct | 12:15 | ECB Rate Decision (EUR) | Read directly against the Fed |
| Fri 30 Oct | 03:00 | BOJ Rate Decision (JPY) | Key test for USD/JPY carry trade |
Risk Warning: Trading financial instruments, particularly those involving leverage, involves a substantial degree of risk and is not appropriate for all investors. The value of your investments can rise or fall sharply, and it is possible to lose the entirety of your invested capital. Do not trade with funds you cannot afford to lose. Nothing in this site should be read or construed as constituting advice on the part of Taurex or any of its affiliates, directors, officers or employees.