Location & Language

Taurex Global Limited regulated by the Financial Services Authority (FSA) of Seychelles (SD092)

U.S. Dollar Weakens Against Russian Ruble Amid Economic Resilience in Russia

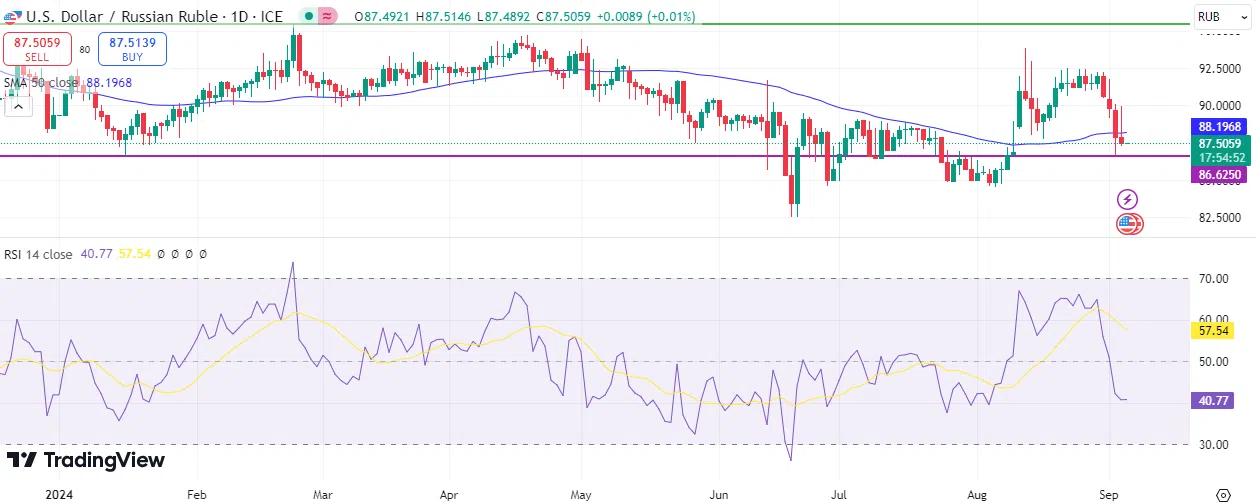
The U.S. dollar continues its downward trend against the Russian ruble for the fourth consecutive day, having reached 86.62 two days ago. It is currently trading near the 87.50 level. The pair remains down by about 2% year-to-date.

Despite the ongoing Western sanctions on Russia since the outbreak of the Russian-Ukrainian war, recent Russian economic data shows that the Russian economy is indeed resilient:

  • The industrial production index rose by 3.3% year-on-year in July, exceeding expectations (2.2%) and the previous reading (2.7%).
  • The retail sales index grew by 6.1% year-on-year in July, surpassing expectations (5.4%) and the previous reading (6.3%).
  • The services PMI (Purchasing Managers’ Index) reached 52.3 points in August, beating expectations (51.1), marking its highest level since January 2024.
  • The Russian central bank’s foreign exchange reserves increased in August to $614.5 billion, exceeding the previous reading of $609.9 billion.
  • The unemployment rate hit a record low of 2.4% in July.

It is worth noting that a significant factor that may provide downward momentum for the USD/RUB pair is the slowdown in the U.S. economy and the increasing market bets on U.S. interest rate cuts. Currently, there is a 56% probability of a 25 basis point cut and a 44% probability of a 50 basis point cut at the September 2024 meeting, which could support the Russian ruble.

From a technical perspective, if the pivot point at 88.39 for the USD/RUB pair is broken, it could target support levels at 86.49, 85.19, and 83.29. Conversely, if the pivot point is surpassed, it may target resistance levels at 89.69, 91.59, and 92.89. The Relative Strength Index (RSI), currently at 40 points, indicates negative momentum for the USD/RUB pair.


Please note that this analysis is provided for informational purposes only and should not be considered as investment advice. All trading involves risk.

Back

Popular Posts

The Chinese yuan between improving economic data and continued pressure in the real...

Brief Overview of Last Week’s Key Economic Events

Gold Prices Trading Sideways Amid a Strong Dollar and Rising Bond Yields

Derivatives as a Tool for Hedging and Risk Management Amid Current Severe Volatility...

Here are some related articles you may find interesting:

Market Insights​

March 17, 2026

The Chinese yuan between improving economic data and continued pressure...

The US dollar against the Chinese yuan has been trading since the beginning of March until today within a horizontal range between 6.8600 and 6.9400,...

Market Insights​

March 16, 2026

Brief Overview of Last Week’s Key Economic Events

Last week witnessed the release of several important economic data points that reflected a mixed picture of the global economy. In the United States, data...

Market Insights​

March 13, 2026

Gold Prices Trading Sideways Amid a Strong Dollar and Rising...

Gold prices have been trading within a horizontal range between $5,000 and $5,200 over the past week until today. The strength of the US dollar...

Market Insights​

March 12, 2026

Derivatives as a Tool for Hedging and Risk Management Amid...

Global financial markets, including equities, bonds, commodities, currencies, and crypto, are currently experiencing significant volatility due to several factors, including: • Geopolitical tensions, particularly the...

Ready to Elevate Your Trading Journey?

Open a Taurex account and start trading today.

Chat on WhatsApp

Live account Registration

1 Hour Trading Consultation

This site is registered on wpml.org as a development site. Switch to a production site key to remove this banner.