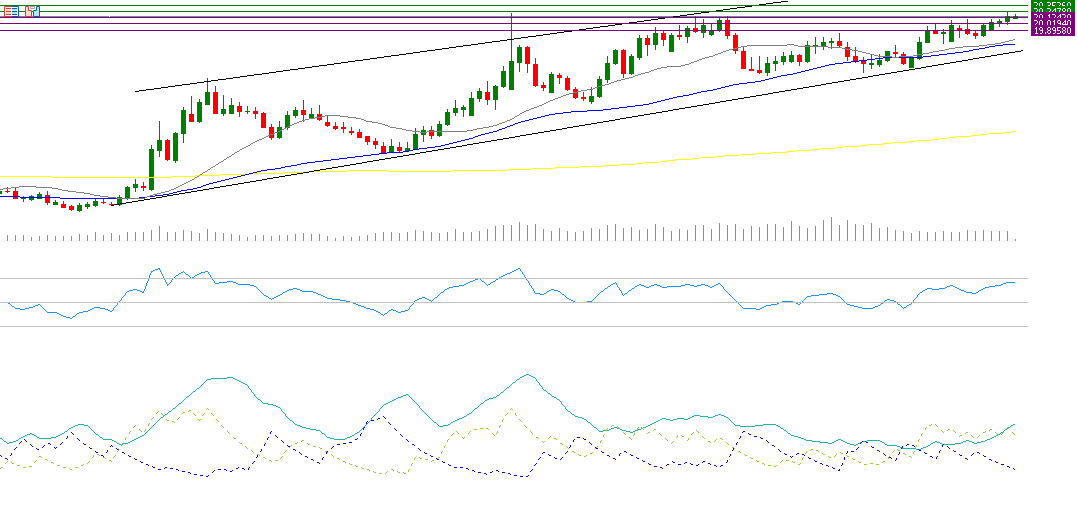
The price of the US dollar against the Mexican peso continues its upward trend, reaching 20.2253 yesterday, the highest level since September 29, 2022. The USD/MXN pair has risen by approximately 19% since the beginning of the year.
Recent economic data from Mexico shows that the Mexican economy is experiencing weakness, as:
- The annual Consumer Price Index (CPI) declined in September, recording 4.58%, which is lower than expectations (4.62%) and the previous reading (4.99%).
- The Purchasing Managers’ Index (PMI) for manufacturing fell to 47.30 in September, lower than the previous reading of 48.50.
- The unemployment rate increased to 2.80%, which is higher than the previous reading of 2.70%.
- The Industrial Production Index showed a contraction of 0.5%, lower than expectations and the previous reading of 0.2%.
- The Consumer Confidence Index decreased to 47.1 in September, lower than the previous reading of 47.6.
- Monthly retail sales showed a growth of 0.1%, which is below expectations (0.2%) and the previous reading (0.7%).
The Gross Domestic Product (GDP) recorded an annual growth of 1.5% for the third quarter of this year, which exceeded expectations (1.2%) but is lower than the previous reading (2.1%).
It is noteworthy that an important factor has provided upward momentum for the USD/MXN pair: the significant possibility that Donald Trump may return to the presidency, as he has pledged to impose tariffs on imports from Mexico, especially cars, which would negatively impact the Mexican peso.
Additionally, the Bank of Mexico has lowered interest rates by 75 basis points this year, from 11.25% to 10.50%, following three reductions of 25 basis points each.
Regarding the technical side, if the pivot point of 20.1242 for the US dollar against the Mexican peso is broken, there is a possibility of targeting support levels of 20.0194, 19.8958, and 19.7910. If the pivot point is exceeded, resistance levels of 20.2478, 20.3526, and 20.4762 may be targeted.
The Relative Strength Index (RSI) currently registers at 66, indicating positive momentum for the USD/MXN pair. The Positive Directional Index (DMI+) is around 30, compared to the Negative Directional Index (DMI-) at about 13. This significant gap between the two indicators suggests strong buying pressure on the US dollar against the Mexican peso.
Please note that this analysis is provided for informational purposes only and should not be considered as investment advice. All trading involves risk.


