
Last week saw several notable economic events globally. In the United States, jobless claims dropped to 201,000, while the non-farm payrolls report showed an addition of 256,000 jobs, strengthening the U.S. economy. Job openings rose to 8.098 million, while the private sector non-farm payrolls showed a decline. In the Eurozone, the Services PMI rose to 51.6 points, while the Consumer Price Index (CPI) increased by 2.4%. In the UK, the Services PMI grew but underperformed expectations. In China, the Caixin Services PMI increased to 52.2 points, the highest in seven months, while foreign exchange reserves dropped to $3.202 trillion. Meanwhile, Australia’s building permits declined by 3.6%, and Switzerland’s CPI rose by 0.6%.
Market Analysis
GBP/USD Pair
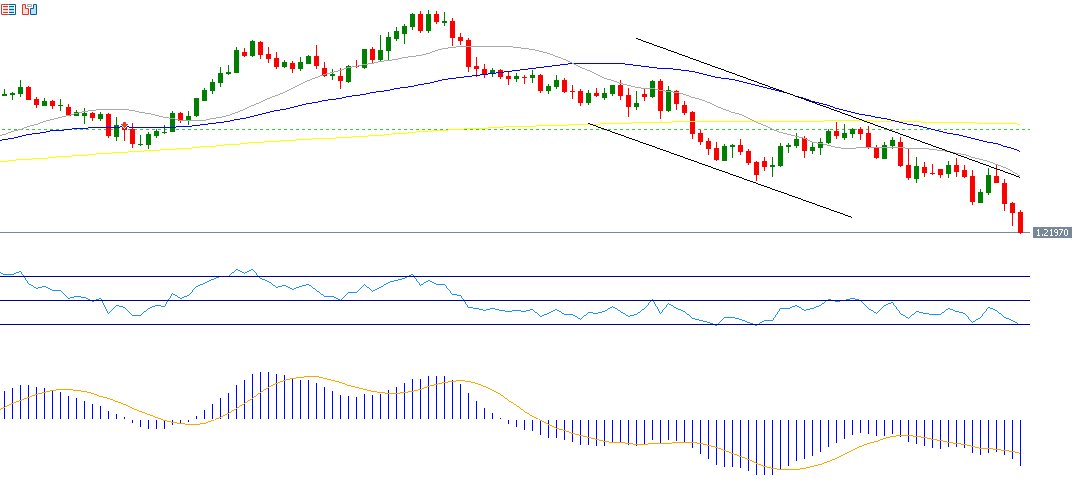
The GBP/USD pair continues its downward trend, reaching 1.2190 on Friday, January 10, 2025, the lowest level since November 10, 2023. It currently hovers around the 1.2200 mark. Factors pressuring the British pound include the weak UK economy, the ongoing political crisis in the UK, and the strength of the U.S. economy and the dollar. The Relative Strength Index (RSI) currently stands at 29, indicating oversold conditions and confirming the bearish momentum for the GBP/USD pair.
JPMorgan Chase
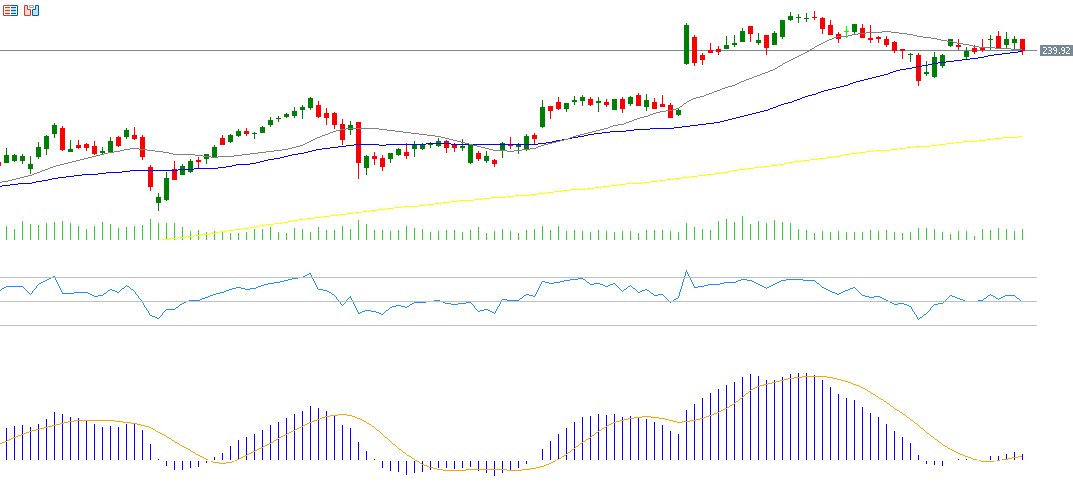
JPMorgan Chase’s stock rose by approximately 42% last year. The markets are eagerly awaiting JPMorgan Chase’s fourth-quarter earnings report, scheduled for Wednesday, January 15, 2025, where the forecast is for a profit of $3.95 per share, down slightly from the previous $3.97. Revenue is expected to reach $41.25 billion, up from the previous $39.90 billion. The RSI currently stands at 50, suggesting a neutral stance on the stock.
Crude Oil
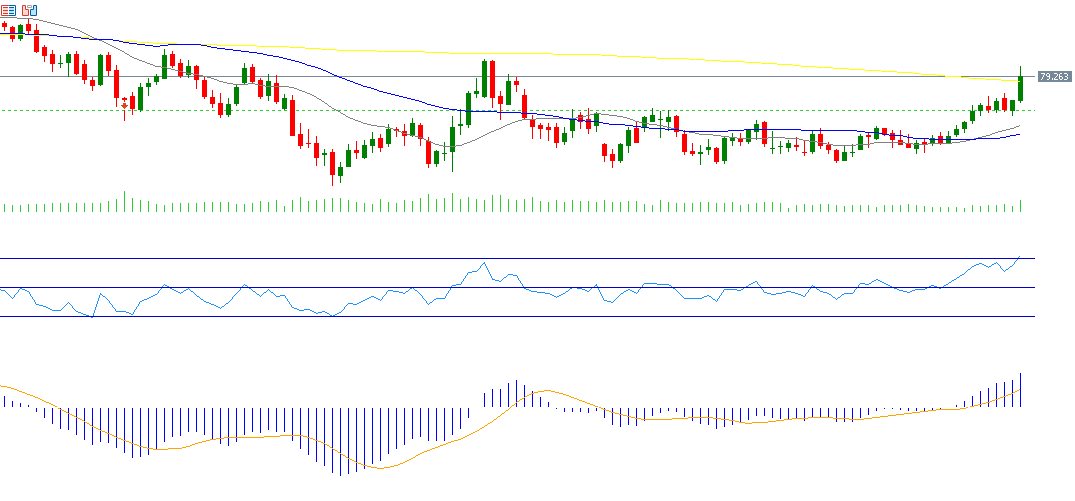
Crude oil prices saw a significant rise on Friday, January 10, 2025, reaching $80.71, the highest level since October 8, 2024, and currently hover around the $80 mark. The bullish trend appears likely to persist, driven by factors such as the ongoing cold wave in Europe and the U.S., which naturally raises heating fuel demand and increases the risk of production disruptions in the U.S., as well as ongoing geopolitical tensions in the Middle East and the Russia-Ukraine war. The RSI currently stands at 72, indicating overbought conditions and confirming the bullish momentum for crude oil. Additionally, the MACD shows a bullish crossover between the blue MACD line and the orange SIGNAL LINE, further supporting the upward momentum for crude oil.
S&P 500 Index
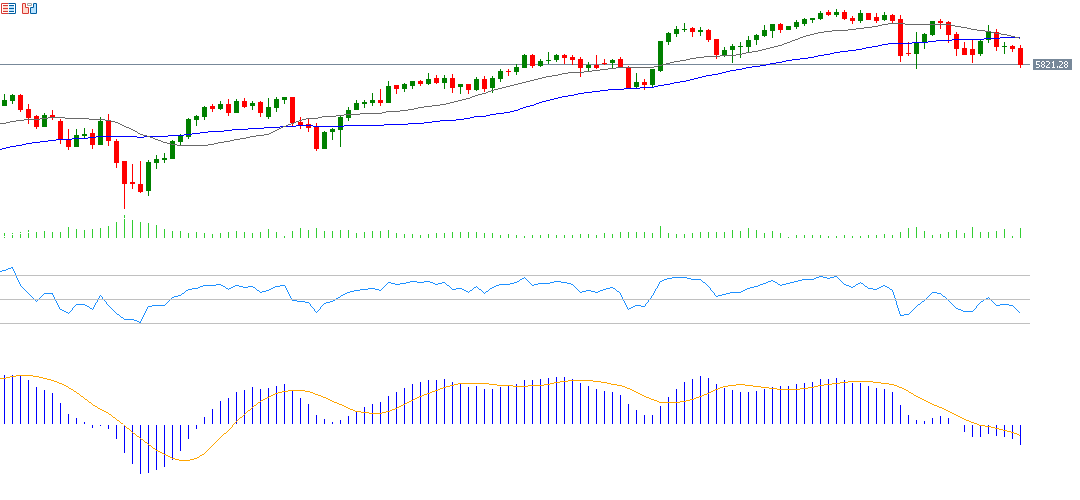
The S&P 500 index has fallen by about 1% since the beginning of the year, driven by stronger-than-expected labor market data, particularly the non-farm payrolls report, which led to a reduction in market expectations for a single rate cut, alongside rising U.S. Treasury yields across various maturities. The RSI currently stands at 39, indicating bearish momentum. The MACD shows a bearish crossover between the blue MACD line and the orange SIGNAL LINE, signaling negative momentum for the S&P 500.
Key Events This Week
Markets are looking forward to several important economic indicators and data releases this week:
- Today: China’s export and import data.
- Tuesday: U.S. Producer Price Index (PPI).
- Wednesday: Consumer Price Index (CPI) data for the U.K. and U.S., along with Empire State Manufacturing Index and U.S. oil inventories.
- Thursday: Employment and unemployment data for Australia, the People’s Bank of China’s benchmark lending rate, U.K. GDP and industrial production, retail sales indicators, U.S. jobless claims, and the Philadelphia Fed manufacturing index.
- Friday: GDP and industrial production indicators, retail sales, fixed asset investment, unemployment rate in China, retail sales in the U.K., CPI in the Eurozone, and U.S. building permits and industrial production data.
Please note that this analysis is provided for informational purposes only and should not be considered as investment advice. All trading involves risk.


