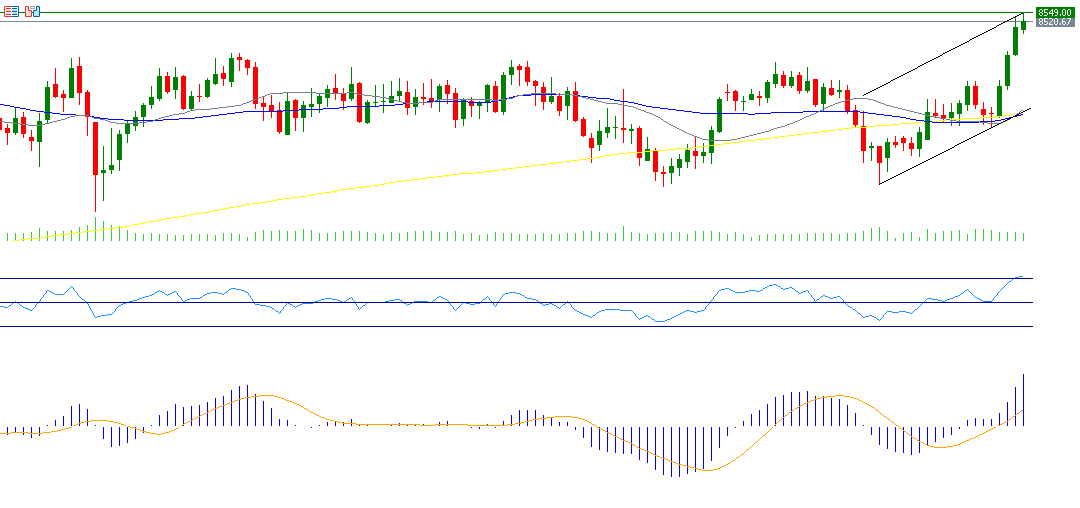
The FTSE 100 Index continues its upward trend for the fourth consecutive day, reaching a new record high of 8,549 points yesterday. It is currently trading near the 8,500-point level, and the positive momentum for this index appears to persist in the upcoming period, having risen by approximately 5% since the beginning of the year.
These notable gains in British stocks are attributed to several factors, including:
- Weakness of the British Pound, which has fallen by about 10% against the dollar since the peak of September 26, 2024, when it stood at 1.3434, to the low recorded on January 13, 2025, which was 1.2100. It is currently trading near 1.2300.
- Decline in the headline Consumer Price Index (CPI) on an annual basis, showing growth of 2.5%, which is lower than expectations and the previous reading (2.6%). Additionally, the core CPI, which excludes food and energy, also decreased on an annual basis, recording a growth of 3.2%, which is below expectations (3.4%) and the previous reading (3.5%), encouraging the Bank of England to continue reducing interest rates this year.
- Decline in UK bond (Gilts) yields across various maturities. For example, the yield on 10-year bonds fell by about 6% since the peak of January 9, 2025, when it stood at 4.925%, to the current levels near 4.650%.
- China as one of the UK’s largest trading partners, with strong recent economic data from China, such as outperforming GDP, export, retail sales, and industrial production indicators, which exceeded analysts’ expectations, providing positive momentum for British stocks.
From a technical perspective, the indicators support the continued rise of the FTSE 100 for the following reasons:
- Bullish crossover between the 20-day moving average, which stands at 8,239 points, and the 50-day moving average, which stands at 8,223 points. This may indicate a continued upward trend for the FTSE 100 index.
- The Relative Strength Index (RSI), currently at 72, indicating the overbought zone, which suggests continued positive momentum for the FTSE 100 index.
- A bullish crossover between the MACD (in blue) and the Signal Line (in orange), indicating positive momentum for the FTSE 100 index.
Please note that this analysis is provided for informational purposes only and should not be considered as investment advice. All trading involves risk.


