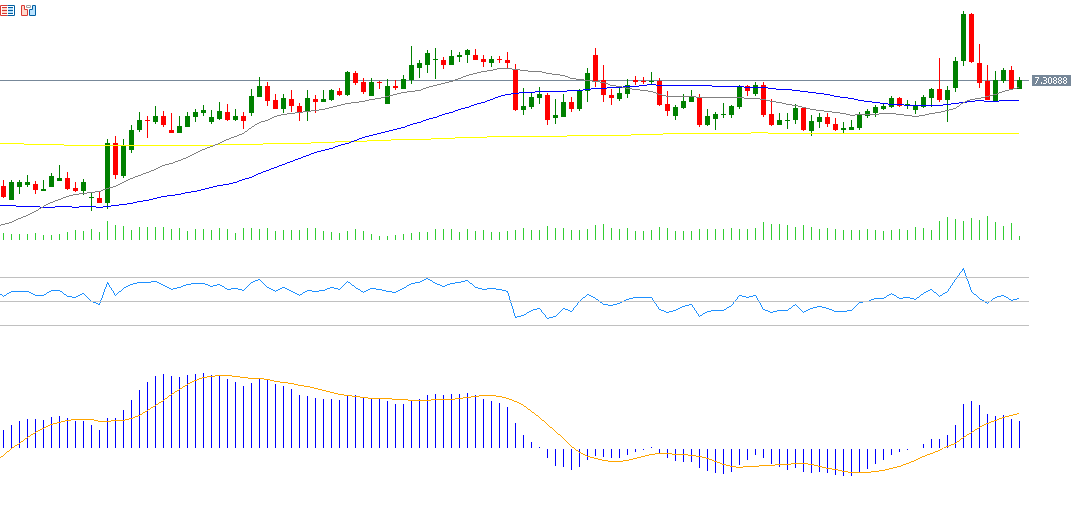
The U.S. dollar rose against the Chinese yuan last week, reaching 7.4290 — its highest level since November 2007, nearly 18 years ago. It is currently trading around the 7.3100 level.
Recently, China has seen a recovery in several key economic indicators:
• GDP grew by 5.4% year-over-year in Q1, exceeding expectations of 5.2%.
• Fixed asset investment rose by 4.2%, slightly above both forecasts and the previous reading (4.1%).
• Industrial production increased by 7.7% year-over-year, well above expectations and the previous reading (5.9%).
• Retail sales grew by 5.9% year-over-year, surpassing both forecasts (4.2%) and the previous figure (4.0%).
• The unemployment rate declined to 5.2%, below both expectations (5.3%) and the previous reading (5.4%).
• Exports surged by 12.4% year-over-year, significantly beating expectations (4.4%) and the prior reading (2.3%).
Investors are closely monitoring the ongoing trade tensions between the U.S. and China, as well as the reciprocal tariffs. This continues to create uncertainty and high volatility in financial markets, especially amid growing competition in areas like technology and artificial intelligence.
While USD/CNY price action remains somewhat uncertain, current technical indicators suggest bearish pressure on the pair:
- Relative Strength Index (RSI): Currently around 39 points, indicating bearish momentum.
- MACD: The blue line is below the orange signal line and in negative territory, pointing to continued negative momentum.
Please note that this analysis is provided for informational purposes only and should not be considered as investment advice. All trading involves risk.

