Bitcoin prices reached a new all-time high of $112,000 yesterday. The cryptocurrency has surged by approximately 50% since its April 7 low, confirming its entry into a bull market. Additionally, Bitcoin has gained about 19% year-to-date.
Notably, the correlation between Bitcoin and the S&P 500 has dropped to its lowest level since last March, currently standing around 0.15—down sharply from 0.84 last month. This decoupling suggests a shift in investor preference toward cryptocurrencies, particularly Bitcoin, amid improving sentiment around digital assets. This comes against the backdrop of a weakening U.S. economic environment characterized by a slowdown and declining confidence among consumers and investors in U.S. assets.
Key factors supporting Bitcoin’s price rally include (but are not limited to):
- Optimism surrounding progress in the U.S. Senate on legislation aimed at regulating stablecoins.
- Continuous inflows into Bitcoin-linked exchange-traded funds (ETFs) for the sixth consecutive week.
- Bitcoin ETF assets under management reaching a record high, surpassing $125 billion.
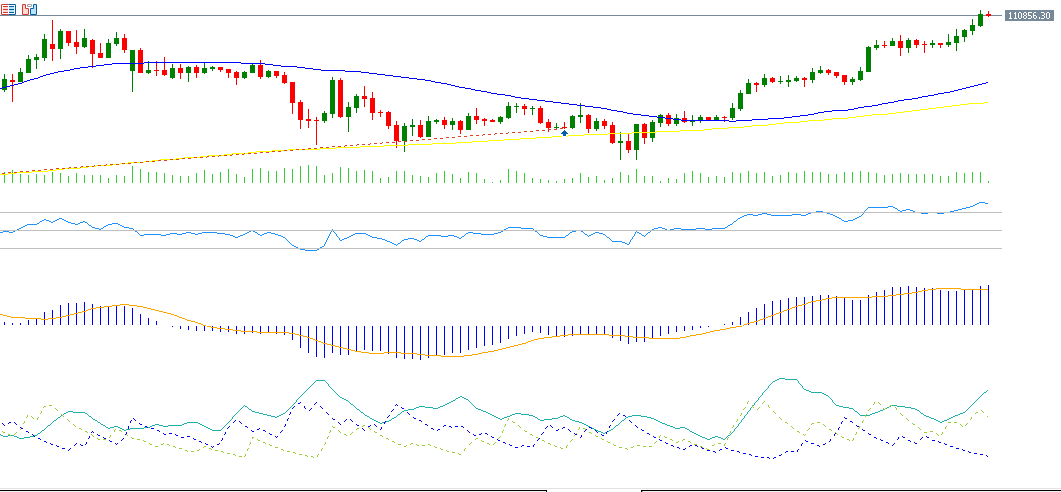
From a technical perspective, several indicators support the continuation of Bitcoin’s upward momentum:
- A bullish “golden cross” has occurred between the 50-day moving average (blue), currently around $94,054, and the 200-day moving average (yellow), currently around $93,633—signaling a strong uptrend.
- The Relative Strength Index (RSI) is currently at 74, indicating overbought territory and reinforcing strong bullish momentum.
- A bullish crossover between the MACD (blue line) and the Signal Line (orange) further supports upward momentum.
- The Positive Directional Movement Index (DMI+) stands at approximately 31 points, while the Negative DMI- is at 12 points, highlighting strong buying pressure. Importantly, the Average Directional Index (ADX) reads around 34, confirming the strength of the ongoing uptrend.
Please note that this analysis is provided for informational purposes only and should not be considered as investment advice. All trading involves risk.


