The USD/CNH exchange rate dropped to 7.1520 on Thursday, June 26, 2025 — its lowest level since November 8, 2024. The pair is currently trading at near 7.1600. From the April 8, 2025 high of 7.4289 to the recent low, the dollar has weakened by nearly 4%, and is down approximately 2% year-to-date.
Meanwhile, the Hang Seng Index has surged around 20% since the beginning of the year, outperforming major U.S., European, and Japanese equity indices. The Hang Seng Tech Index has also gained 19% over the same period, beating the performance of the U.S. Nasdaq 100.
Recent Chinese economic data has shown notable improvement. The Manufacturing Purchasing Managers’ Index (PMI) recorded a contraction of 49.7 — higher than both expectations (49.6) and the previous reading (49.5). The Non-Manufacturing PMI posted growth at 50.5, also surpassing forecasts and the previous figure (50.3).
Despite a recent trade agreement between China and the U.S., uncertainty remains over future trade relations, compounded by rising competition between the two countries in areas such as technology and artificial intelligence.
A key factor pressuring the USD/CNH pair is the broad weakness in the U.S. dollar, particularly against Asian currencies. Bloomberg’s Asia Currency Index continues to rise, marking its fourth consecutive month of gains.
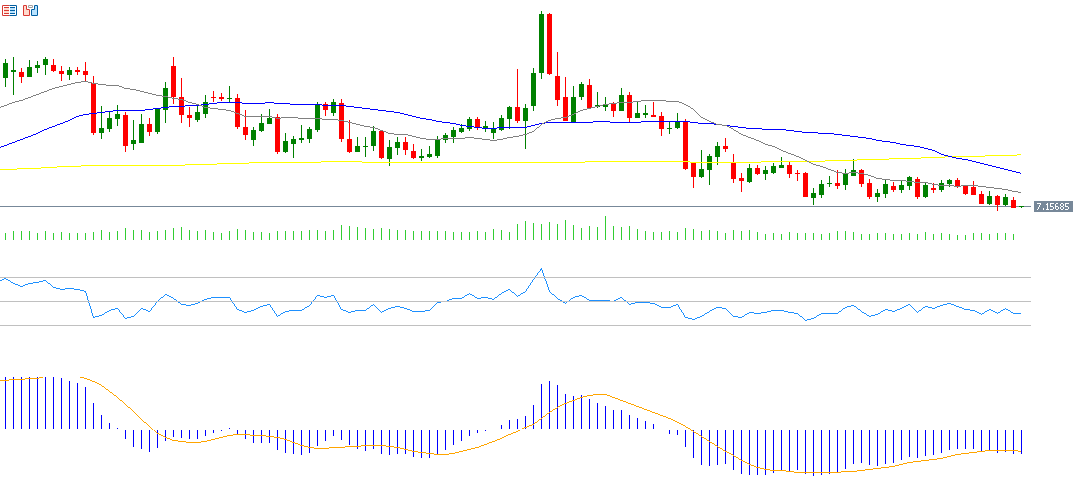
Technical Outlook: Continued Downward Pressure
Several technical indicators point toward sustained downside pressure on the USD/CNH pair:
- Bearish Crossover: On June 20, 2025, the 20-day moving average (gray) crossed below the 50-day moving average (blue), indicating a bearish signal.
- Relative Strength Index (RSI): Currently around 39, suggesting a bearish momentum.
- MACD: The MACD line (blue) remains below the signal line (orange), and both are in negative territory — a further sign of bearish momentum.
Support and Resistance Levels:
- If the pair breaks below the pivot point at 1710, it may target support levels at 7.1676, 7.1625, and 7.1591.
- Conversely, if it breaks above the pivot point, resistance levels to watch are 1761, 7.1795, and 7.1846.
Please note that this analysis is provided for informational purposes only and should not be considered as investment advice. All trading involves risk.


