For the first time in market history, Nvidia’s market capitalization surpassed $4 trillion, overtaking both Apple and Microsoft. The company’s valuation has soared by over 1000% since the beginning of 2023 and currently represents about 7.50% of the S&P 500 index.
This record-breaking surge in Nvidia’s value is primarily driven by surging demand for its semiconductor chips — both from domestic clients such as Microsoft, Amazon, and Apple, and international clients, despite U.S. government restrictions on exporting Nvidia chips to China as part of Washington’s efforts to limit China’s technological advancements. Market expectations suggest Nvidia’s market cap may continue rising in the coming period.
Nvidia’s share price reached a record high of $164.50 yesterday. The stock has gained nearly 90% since hitting a low of $86.62 on April 7, 2025, and is up about 22% year-to-date. It closed yesterday at $164.10.
Notably, Nvidia’s stock has outperformed major U.S. equity benchmarks like the S&P 500 and Nasdaq 100, as well as the Magnificent 7 index.
Markets are now looking ahead to Nvidia’s Q2 earnings release, scheduled for Wednesday, August 27, 2025. Analysts expect earnings of $1.00 per share, up from the previous reading of $0.68 per share. Revenue is projected to reach $45.58 billion, compared to $30.00 billion in the previous quarter.
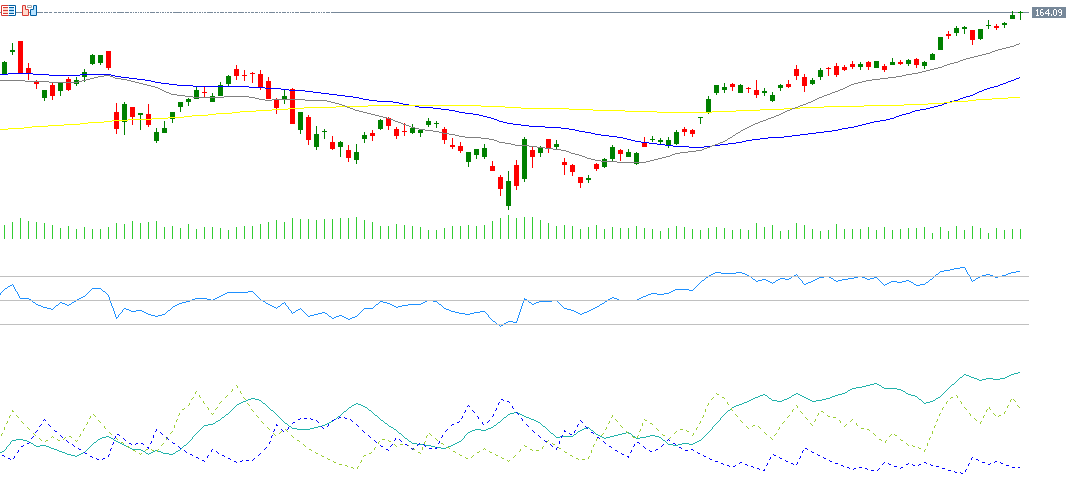
From a technical perspective, indicators suggest Nvidia’s bullish momentum may continue for the following reasons:
- Moving Averages: The 20-, 50-, and 200-day moving averages are all trending upward. The 20-day MA is above the 50-day, which is in turn above the 200-day — a very positive alignment. Additionally, the 20-day MA at $152 acts as a key support level, currently well below the market price, reinforcing the bullish setup.
- RSI (Relative Strength Index): Currently at 74, the RSI indicates overbought conditions, reflecting strong bullish momentum.
- Directional Movement Index (DMI): The positive directional indicator (DMI+) is around 39, while the negative directional indicator (DMI–) is near 11, suggesting strong buying pressure. Moreover, the Average Directional Index (ADX) stands at 46, signaling a strong upward trend.
Please note that this analysis is provided for informational purposes only and should not be considered as investment advice. All trading involves risk.


