
The Federal Open Market Committee (FOMC) decided in its meeting yesterday to cut interest rates by 25 basis points, as markets had anticipated, bringing the target range to 4.00%–4.25%. More importantly, the “dot plot” projections pointed to an additional 50 basis points in rate cuts expected later this year.
Federal Reserve Chair Jerome Powell, in his press conference, stated that the slowdown in GDP growth largely reflects a decline in consumer spending. He also noted that prices are expected to rise due to tariffs over the current and upcoming year, and that labor market risks were a key driver behind the rate cut decision in this meeting.
How Did the “Dot Plot” and Powell’s Comments Impact Financial Markets?
- Major U.S. stock indices closed mixed:
- The S&P 500 closed down by 0.10%
- The Nasdaq 100 fell by 0.21%
- The Dow Jones closed higher with a gain of 0.55%
- Gold prices, after hitting a new all-time high of $3,708 yesterday, ended the day down by 0.87%
- Crude oil and Bitcoin prices also closed with losses of around 0.80% and 0.31% respectively
- Most major foreign currencies declined against the U.S. dollar
What About U.S. Treasury Yields?
Yields on both short- and long-term U.S. Treasury bonds rose, as prices fell:
- The 2-year Treasury yield rose by 1.23%, reaching 3.55%
- The 10-year Treasury yield increased by 1.36%, hitting 4.08%
So, Who Was the Biggest Winner?
The biggest winner was the U.S. Dollar Index, which:
- Closed at 97.02 yesterday
- Rose by approximately 0.37%
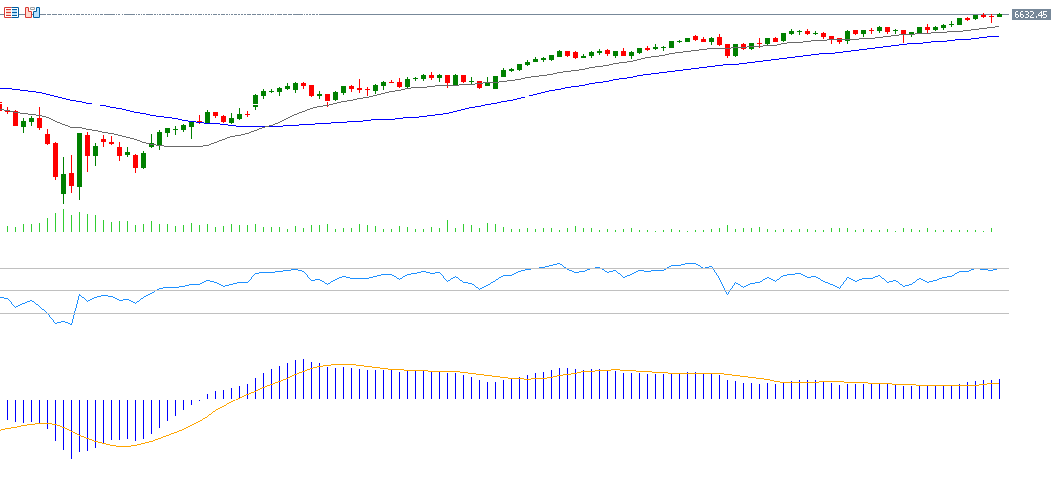
Technical Outlook for the S&P 500
The upward trend in the S&P 500 appears to remain intact:
- It reached a record high of 6,627 two days ago
- Closed at 6,600 yesterday
Technical indicators suggest the potential for continued upside for the following reasons:
- The 20-day, 50-day, and 200-day moving averages are all trending upward in alignment
- The Relative Strength Index (RSI) is currently at 67, approaching the overbought zone
- A bullish crossover is visible between the MACD line (blue) and the signal line (orange), supporting the continuation of positive momentum
Please note that this analysis is provided for informational purposes only and should not be considered as investment advice. All trading involves risk.


