
Gold prices fell significantly today to $4,004, marking their lowest level since October 10, 2025. This comes after reaching a record high of $4,382 on Monday — a decline of about 9% from peak to trough. The primary reason behind this sharp drop is profit-taking by investors, which is a natural market reaction, especially following a strong rally that saw gold surge over 60% from the beginning of the year.
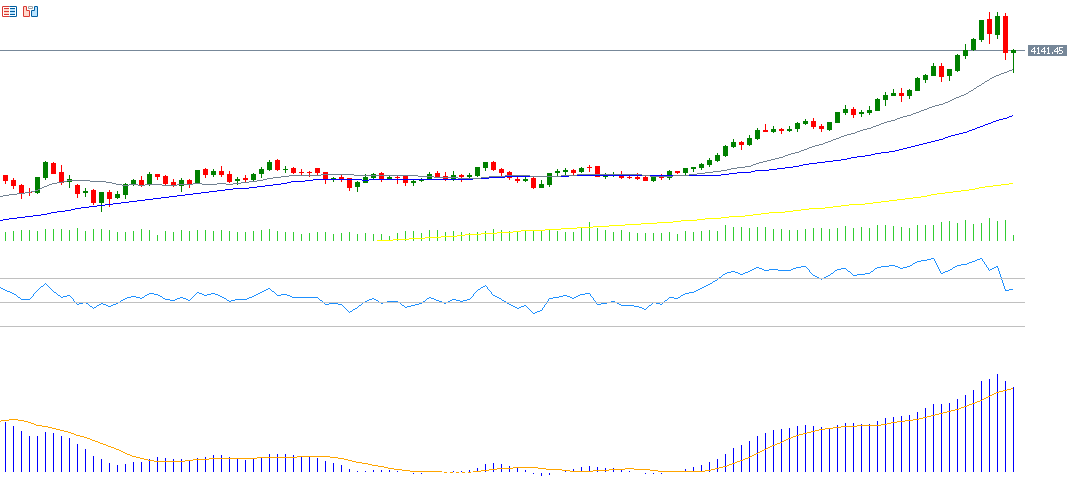
Additionally, prices had entered an overbought zone and remained there for an extended period from early September. Naturally, this led the Relative Strength Index (RSI) to break below the 70 level, falling to 60 yesterday. Despite the decline, the RSI remains in positive territory above the 50 level. It is crucial to monitor this indicator closely — a drop below 50 would be a negative signal for gold and could drive prices down toward the psychological support level at $4,000, which also aligns with the 20-day moving average.
Two other factors have contributed to gold’s recent pullback:
- The easing of trade tensions between the United States and China, following an agreement between the two presidents to meet at the South Korea summit next week. President Trump stated that Washington is aiming for a “fair and great” trade agreement.
- The White House economic advisor suggested the ongoing U.S. government shutdown may end this week.
Despite these negative developments for gold, several key factors continue to support bullish momentum in the coming period, including:
- Central bank gold purchases, which account for around 20% of total global demand. Major central banks — especially the People’s Bank of China — are continuing to increase their gold reserves, boosting demand and supporting prices.
- Market expectations of a 25-basis point interest rate cut, almost fully priced in for the upcoming Federal Reserve meeting on Wednesday, October 29. A further 25 basis point cut is also expected in December, which favors gold as a non-yielding asset.
- Ongoing geopolitical tensions, such as the Russia-Ukraine war, which remains far from a resolution.
- The continuation of the U.S. government shutdown for the 21st consecutive day, with no agreement yet between Republicans and Democrats. The longer the shutdown persists, the more it reinforces gold’s status as a safe-haven asset.
- Ongoing political pressure from President Donald Trump on the Federal Reserve.
- Inflationary risks in the U.S., with inflation hovering around 3% — above the Federal Reserve’s 2% target — prompting investors to view gold as a hedge against inflation.
- Continued trade tensions between the Trump administration and other countries, with tariffs remaining a core element of U.S. trade policy.
Notably, gold mining stocks have shown remarkable performance, outperforming major technology companies. Shares in Barrick are up around 105%, Newmont is up 132%, and Agnico Eagle have risen by approximately 109%.
From a technical perspective:
- There remains a bullish alignment among the 20-, 50-, and 200-day moving averages. The 20-day MA is above the 50-day MA, which is in turn above the 200-day MA.
- The RSI, despite a noticeable drop, still stands at 60, indicating ongoing positive momentum for the yellow metal.
- The MACD indicator continues to show the blue line above the signal line (orange), confirming the sustained bullish momentum in gold prices.
Please note that this analysis is provided for informational purposes only and should not be considered as investment advice. All trading involves risk.


