
Crude oil prices rose by approximately 3.24% last week, reaching around $70 on Friday — a level that represents resistance at the 200-day moving average. However, prices have declined since the beginning of this week, with oil reaching $65.64 yesterday, marking a nearly 6% drop from last Friday’s peak of $70 to yesterday’s low.
Oil prices have been trading in a narrow range between $65 and $70 since early August and are currently hovering around the $66 level. Overall, crude oil prices have declined by about 12% year-to-date.
The key bearish factors weighing on crude oil prices include:
- US President Donald Trump’s announcement of a potential agreement to end the war in Gaza, which has reduced the geopolitical risk premium.
• The upcoming OPEC+ meeting on Sunday, October 5, where a production increase of 137,000 barrels per day for November is expected.
• An abundant oil supply from non-OPEC+ producers.
• Weak recent economic data from major oil importers such as China, which has put pressure on global oil demand.
On the other hand, bullish factors supporting oil prices include:
- Market expectations of two additional US interest rate cuts this year, which could boost oil demand.
• Ongoing geopolitical tensions between Russia and Ukraine, with continued Ukrainian strikes on Russian energy infrastructure raising concerns over supply disruptions.
• A weakening US dollar, which tends to support oil prices due to the inverse relationship between the two, along with expectations of further dollar weakness in the near term.
It’s also worth noting that Russian oil exports to India have fallen to their lowest level since October 2022, while China’s imports of Iranian oil via Malaysia have declined by more than 40%.
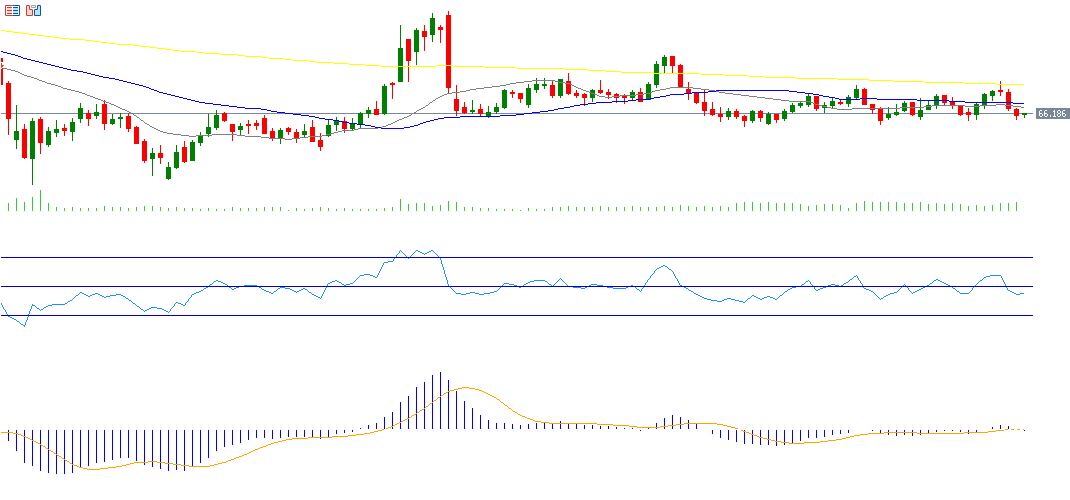
From a technical perspective, crude oil is currently trading below the key support level of the 50-day moving average (blue), which stands at $67.67, while hovering just above the second support level, the 20-day moving average (gray), located at $67.23. The next critical challenge will be whether prices will test the strong support at $65.
As for the Relative Strength Index (RSI), it is currently reading 43, indicating negative momentum in oil prices. Additionally, a bearish crossover has formed between the MACD line (blue) and the Signal line (orange), which further supports the likelihood of continued bearish momentum in crude oil.
Please note that this analysis is provided for informational purposes only and should not be considered as investment advice. All trading involves risk.

