
The Australian dollar (AUD) hit 0.6636 against the U.S. dollar (USD) yesterday, marking its highest level since November 8, 2024. The AUD/USD pair has surged by approximately 12% since the April 9, 2025 low of 0.5913, up to the recent high. It has also gained around 7% year-to-date and is currently trading near the 0.6600 level.
Recent Australian economic data reflects resilience in economic performance, as:
- The Manufacturing PMI rose to 53.0 points, exceeding both expectations and the previous reading (52.9).
- The Services PMI climbed to 55.8 points, also beating expectations (55.1) and the previous reading (54.1).
- GDP for the second quarter of this year grew by 0.6%, higher than both the forecast (0.5%) and the previous reading (0.3%).
- The trade balance recorded a surplus of AUD 7.310 billion, surpassing expectations (AUD 4.880 billion) and the previous reading (AUD 5.336 billion).
It’s also worth noting that Australia’s Consumer Price Index (CPI) stands at 2.10%, which is within the Reserve Bank of Australia’s (RBA) target range — indicating controlled and balanced inflation.
Additionally, a key factor boosting the AUD/USD pair is the weakness in the U.S. Dollar Index, which is trading around 98 points. This is largely due to market expectations of three rate cuts by the Federal Reserve this year, adding further pressure on the greenback.
Markets are now looking ahead to the RBA’s interest rate decision on September 30, with expectations pointing to a rate hold at 3.60%.
Technical Outlook:
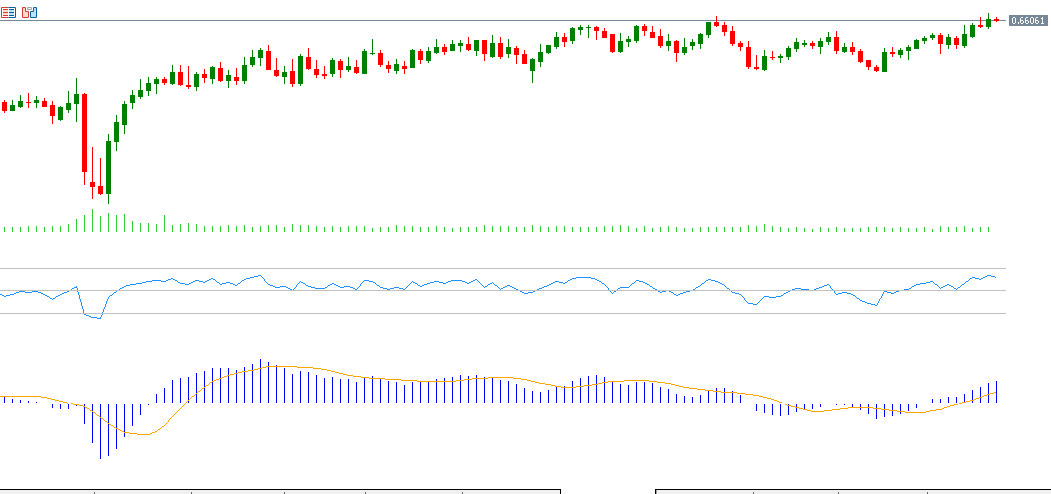
If the pivot point at 0.6612 is broken to the downside, the pair may target support levels at 0.6587, 0.6555, and 0.6530. Conversely, if the pair moves above the pivot point, resistance levels may be targeted at 0.6644, 0.6669, and 0.6701.
The Relative Strength Index (RSI) is currently at 63, indicating bullish momentum in the AUD/USD pair. Meanwhile, the MACD shows a bullish crossover between the blue line and the orange signal line, supporting the continuation of upward momentum.
Please note that this analysis is provided for informational purposes only and should not be considered as investment advice. All trading involves risk.

