By Samir Al Khoury
Economic indicators in China, the world’s second-largest economy, reveal signs of weakness in the ongoing recovery. In October, both manufacturing and non-manufacturing purchasing managers’ numbers disappointed, with the manufacturing sector contracting to 49.5 points, falling below the expected 50.2 points. The non-industrial sector showed growth at 50.6 points but below expectations at 51.8 points. Inflation indicators also reflected the economic struggle, with the consumer price index contracting by 0.2% annually and the producer price index by 2.6%, signalling weak domestic and industrial demand.
The export index mirrored this trend, contracting by 6.4% in October, indicating a decline in external demand. This weakness in the Chinese economy is due to many factors, the most prominent of which are:
- An ongoing crisis in the real estate sector, which represents approximately 30% of China’s GDP, which in turn is burdening the Chinese economy.
- Declining consumer confidence.
- Exit of foreign investments from Chinese markets.
- Decline in demand for Chinese exports.
Despite various stimulus measures announced by Chinese authorities, experts believe the economy requires additional support to reestablish a robust recovery. Market watchers eagerly await upcoming indicators of investment in fixed assets, industrial production, retail sales, and the unemployment rate in China.
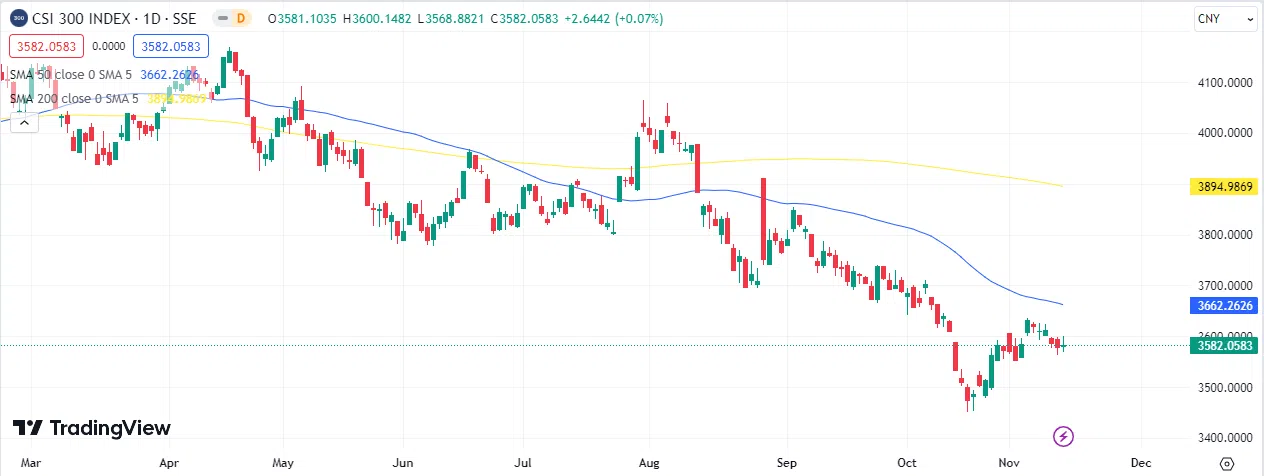
Chinese stocks, particularly the CSI 300 Index, have disappointed investors, currently trading at 3,582 points—below the 50-day moving average of 3,662 points and the 200-day moving average of approximately 3,894 points. The Relative Strength Index sits at around 42 points, below the 50-point barrier, indicating negative momentum for the CSI 300 index.
Please note that this analysis is provided for informational purposes only and should not be considered as investment advice.
Taurex is the trading name of Zenfinex Global Limited, Stochastic Africa SL Ltd, Zenfinex Global LLC, and Zenfinex Limited.
Zenfinex Global Limited is registered in the Republic of Seychelles with registration number: 8428731-1 and is regulated by the Financial Services Authority of Seychelles (license number SD092). Its registered office address is F20, 1st Floor, Eden Plaza, Eden Island, Seychelles.
Stochastic Africa (SL) Limited is a company registered in Sierra Leone with Company Number: SL270319STOCH05271 and is licensed by the Bank of Sierra Leone under license number BSL/SAL/2023 and with the registered office at 148D Wilkinson Road, Freetown, Sierra Leone.
Zenfinex Global LLC is a company registered with the Financial Services Authority in Saint Vincent and the Grenadines under registered number 138 LLC 2019. Its registered office is Hinds Building, Kingstown, Saint Vincent, and the Grenadines.
Zenfinex Limited is a company registered in England and Wales under registered number: 11077380. Authorised and regulated by the Financial Conduct Authority under firm reference number 816055. Its registered office is 4th Floor, 4 Eastcheap, London, EC3M 1AE, United Kingdom.
*All trading involves risk.