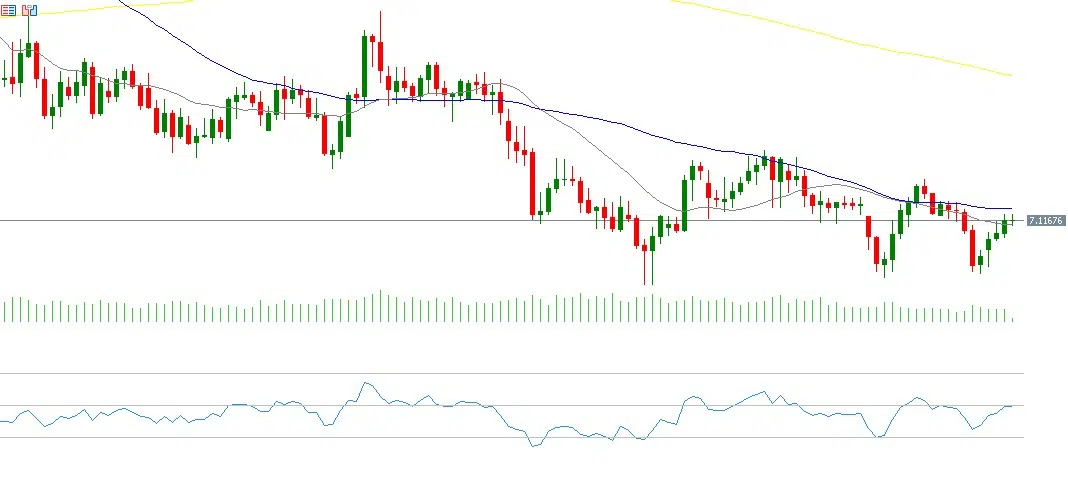
The USD/CNH exchange rate recorded 7.1205 today, marking its fifth consecutive daily rise. Despite this upward movement, the pair has been trading sideways for the past two months within a horizontal range between 7.1000 and 7.1500. The pair remains roughly 3% year-to-date.
In addition, despite the initial trade agreement between China and the United States, uncertainty persists regarding the durability of this deal, especially amid intense competition between the two nations in areas such as technology and artificial intelligence. Geopolitical tensions surrounding Taiwan, as well as cautious escalation between China and Japan regarding the issue, further contribute to the uncertainty.
Recent Chinese economic data has shown significant signs of slowdown, indicating the need for additional stimulus measures from Chinese authorities to support growth, production, and consumption. Notable data include:
- Industrial production grew 4.9% year-over-year in October, below expectations (5.5%) and the previous reading (6.5%).
• Retail sales rose 2.9% year-over-year in October, slightly higher than expectations (2.7%) but below the previous reading (3.0%).
• Fixed asset investment contracted by 1.7% year-over-year, worse than expectations (-0.9%) and the previous reading (-0.5%).
• New home prices fell 2.2% year-over-year, matching the previous reading.
• New loans totaled 220 billion yuan in October, significantly lower than expectations (460 billion) and the prior figure (1,290 billion).
• The official Manufacturing PMI registered 49.0, below expectations (49.6) and the previous reading (49.8).
• The Caixin Manufacturing PMI came in at 50.6, below expectations (50.7) and the previous reading (51.2).
• Imports grew 1.0% year-over-year, below expectations (3.2%) and the previous reading (7.4%).
• Exports fell 1.1% year-over-year, below expectations (3.0%) and the previous reading (8.3%).
From a technical perspective, indicators signal the possibility of a decline in the USD/CNH pair in the coming period for several reasons:
- Death Cross: A bearish crossover persists between the 20-day and 50-day moving averages, indicating ongoing downward momentum.
- Relative Strength Index (RSI): Currently around 49 points, reflecting bearish bias.
Please note that this analysis is provided for informational purposes only and should not be considered as investment advice. All trading involves risk.

