Despite various government stimulus measures to support the Chinese economy, recent economic data indicate that the Chinese economy is struggling, highlighting the need for further intervention by Chinese authorities to bolster economic growth. Specifically:
- The Consumer Price Index (CPI) grew by 0.6% year-over-year in August, which is below expectations (0.7%) but higher than the previous reading (0.5%).
- The Producer Price Index (PPI) recorded a decline of 1.8% year-over-year, worse than expectations (-1.5%) and the previous reading (-0.8%).
- The Manufacturing Purchasing Managers’ Index (PMI) fell to 49.1 points, lower than expectations (49.5) and the previous reading (49.4).
- The import index grew by 0.5% year-over-year in August, below expectations (2.0%) and the previous reading (7.2%), indicating weak domestic demand.
- The real estate sector, which constitutes nearly 30% of China’s GDP, remains troubled.
- Tensions between China and the United States regarding trade and technology continue.
Despite these negative indicators, the export index recorded an 8.7% growth yesterday, surpassing expectations (6.5%) and the previous reading (7.0%), suggesting strong external demand. Additionally, Chinese stock valuations remain attractive and significantly lower compared to other global stocks, such as Japanese and American equities. For example, the price-to-earnings ratio of the CSI300 Index is below 10 times.
J.P. Morgan has downgraded its recommendation for Chinese stocks from “Buy” to “Neutral,” noting that a potential trade war between Washington and Beijing could harm Chinese stocks.
Analysts are closely watching the release of fixed-asset investment, industrial production, retail sales, and unemployment rate indicators in China on Saturday.
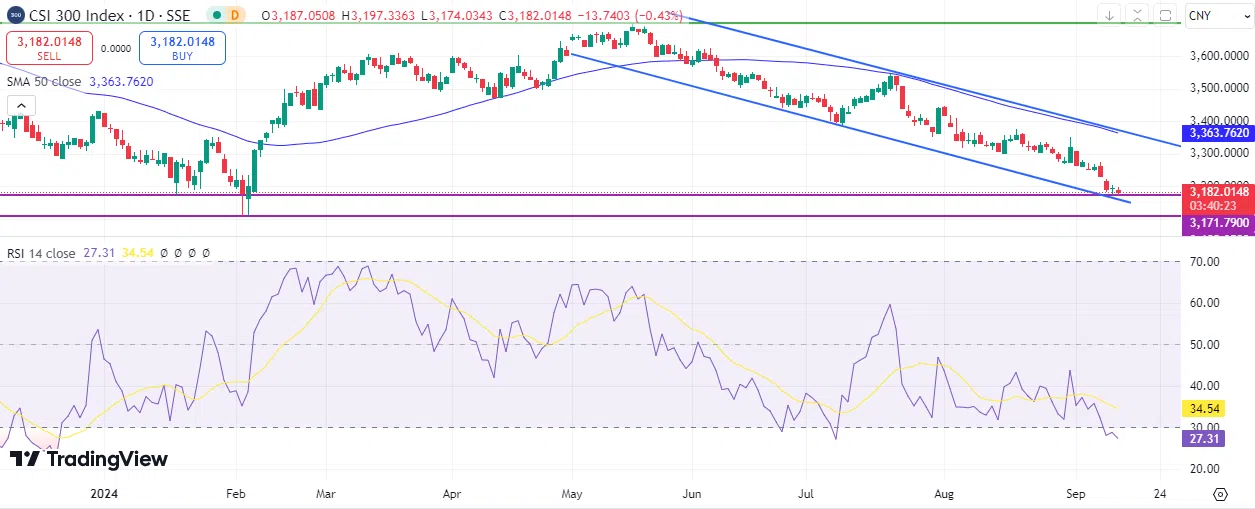
The technical outlook for Chinese stocks appears discouraging, especially since the CSI300 Index, currently trading at 3,180 points, is below the 20, 50, and 200-day moving averages, indicating a bearish trend. The CSI300 Index reached 3,171 points yesterday, the lowest level since February 5, 2024, down approximately 14% from the peak of 3,703 points recorded on May 20, 2024, to the September 10 low of 3,171 points. It has also fallen about 7% since the beginning of the year. Furthermore, the Relative Strength Index (RSI), currently around 27 points, indicates an oversold condition, reflecting the negative momentum of the CSI300 Index.
Please note that this analysis is provided for informational purposes only and should not be considered as investment advice. All trading involves risk.


