
Crude oil prices have risen by approximately 8% since hitting a low of $58.44 on Monday this week, climbing to a peak of $63.17 as of yesterday. Currently, prices are hovering around $61.00, amid prevailing uncertainty in the oil market, which is influenced by various conflicting factors. On a year-to-date basis, oil prices are down by roughly 18%.
Positive Factors Supporting Oil Prices:
- Easing trade tensions between the United States and China, with ongoing negotiations in Switzerland this week raising hopes for a breakthrough.
- Rising geopolitical tensions in the Middle East, along with escalating strains between India and Pakistan, are adding to the risk premium on oil prices.
- Stimulus measures from the People’s Bank of China to support the economy: the reserve requirement ratio was cut by 0.5%, the 7-day reverse repo rate was reduced by 10 basis points from 1.5% to 1.4%, and ¥500 billion in incentives were introduced to boost consumption and growth.
- Increased demand from refineries ahead of the summer season, which typically sees higher oil consumption, is lending support to prices.
Negative Factors Pressuring Oil Prices:
- The OPEC+ alliance approved another production increase for June, adding 411,000 barrels per day to the market, following a similar move last month.
- Concerns over a potential economic recession in the United States.
Technical Analysis:
Technical indicators continue to point to bearish momentum in oil prices due to the following reasons:
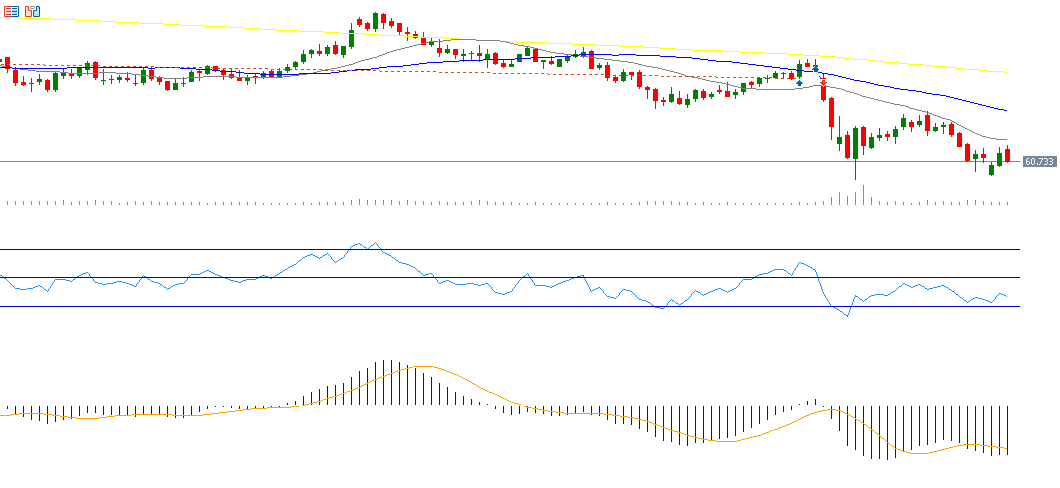
- Moving averages (200-day, 50-day, and 20-day) are aligned in a downward trend. The 200-day moving average is above the 50-day, which in turn is above the 20-day average. The key challenge now lies in breaking the resistance at the 20-day moving average, located at $64.20.
- The Relative Strength Index (RSI) currently stands at 37 points, indicating negative momentum.
- The bearish crossover between the MACD line (blue) and the signal line (orange) remains in place, reinforcing the ongoing downward pressure on crude oil prices.
Please note that this analysis is provided for informational purposes only and should not be considered as investment advice. All trading involves risk.

