Cryptocurrency markets are known for their significant volatility, but recently, we’ve witnessed sharp fluctuations, particularly after the announcement of Trump’s victory in the U.S. presidential election on November 5th. This led to a bullish momentum across all cryptocurrencies after Trump pledged strong support for the industry.
Notably, we have seen continued liquidity flowing into cryptocurrency products for the eighth consecutive week.
In addition to the ongoing rise of the two largest cryptocurrencies by market capitalization, Bitcoin ($2 trillion) and Ethereum ($460 billion), we have seen a notable rise in Ripple (XRP), which has surpassed Solana, and BNB in market capitalization, currently recording $130 billion and securing the fourth spot ahead of Tether (USDT) ($135 billion).
It is worth mentioning that there is talk of large investment institutions that have filed requests with the U.S. Securities and Exchange Commission (SEC) to list Ripple-related ETFs.
Cryptocurrencies in general, and Ripple in particular, have faced legal challenges from the SEC in the past. However, with the resignation of SEC Chairman Gary Gensler, who was known for his strict stance on cryptocurrencies, and his departure from the position on January 20, 2025, when Trump officially resumes the presidency, there are talks about nominating Paul Atkins as Gensler’s successor. Atkins has been a strong advocate for the digital asset industry, having chaired the Digital Chamber of Commerce’s Token Alliance since 2017. He has also been a staunch defender of innovation and clarity in regulating the industry, which may signal continued positive momentum for cryptocurrencies.
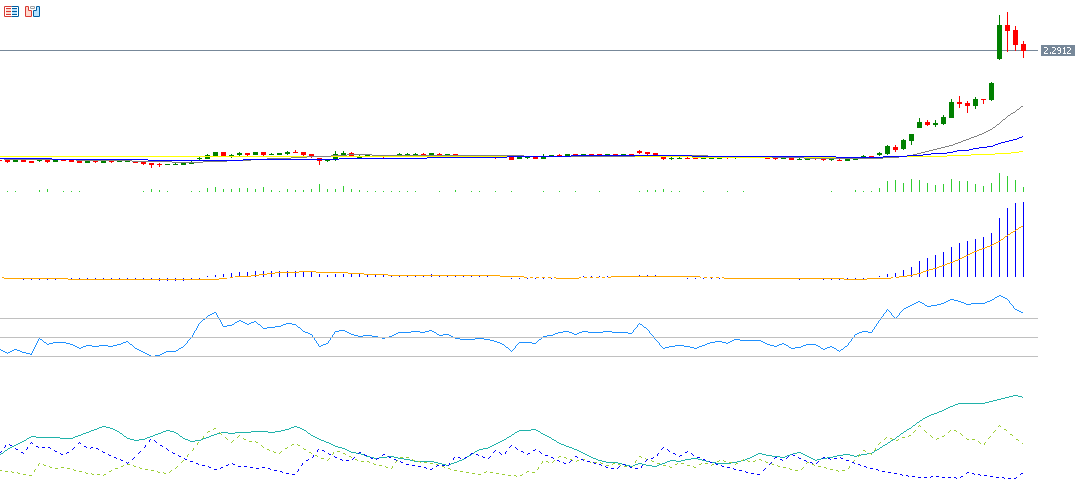
Ripple’s price continues its upward trend, recently recording $2.9055, its highest level since January 4, 2018. It is currently trading near $2.30. Ripple’s price has risen by approximately 300% since the beginning of the year, outperforming both Bitcoin (which increased by about 140%) and Ethereum (which rose by about 70%). The biggest challenge for Ripple is to reach and surpass the $3 mark and then target the $3.3170 level, which it reached on January 4, 2018.
From a technical perspective, indicators suggest that Ripple’s price could continue to rise for the following reasons:
- The Relative Strength Index (RSI) is currently at 74, in the overbought region, indicating bullish momentum for Ripple.
- The MACD indicator (blue) has crossed above the Signal Line (orange), signaling bullish momentum.
- The Positive Directional Indicator (DMI+) is at around 40, compared to the Negative Directional Indicator (DMI-) at around 5. The large gap between these two indicates strong buying pressure on Bitcoin. More importantly, the Average Directional Index (ADX) is at around 72, suggesting strong momentum in the upward trend.
- The alignment of the 20-day, 50-day, and 200-day moving averages, with their upward direction, shows that the 20-day average is above the 50-day, and the 50-day is above the 200-day, further supporting the bullish trend.
Please note that this analysis is provided for informational purposes only and should not be considered as investment advice. All trading involves risk.


