
Recent Chinese economic data has shown a clear divergence. Retail sales grew by 3.0% year-on-year in September, which was higher than expectations (2.9%) but lower than the previous reading (3.4%), indicating continued weakness in consumer spending. Additionally, fixed asset investment contracted by 0.5% year-on-year — marking the first decline since 2020. Moreover, the annual decline in home prices accelerated, registering a 2.2% drop despite ongoing government support measures aimed at the struggling real estate sector.
On the other hand, China’s GDP grew by 4.8% year-on-year in the third quarter of this year, slightly above expectations (4.7%) but below the government’s target of 5%. Furthermore, industrial production rose by 6.5% year-on-year in September, exceeding both expectations (5.0%) and the previous reading (5.2%).
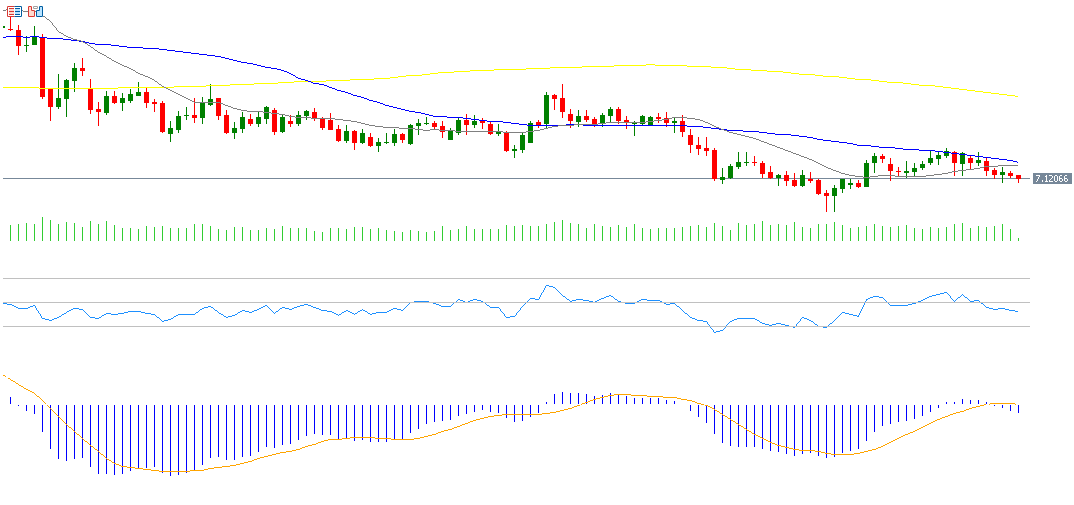
The USD/CNH exchange rate has been trading within a sideways range between 7.1000 and 7.1500 over the past month, as the pair seeks a clearer directional trend. The pair has declined by around 3% year-to-date.
As for the Hang Seng Index, it has risen by approximately 31% since the beginning of the year, outperforming U.S., European, and Japanese equity indices. The Hang Seng Tech Index also posted a strong gain of 36% during the same period, outpacing the U.S. Nasdaq 100 Index.
Uncertainty continues to cloud the future of U.S.-China trade relations. The Trump administration had imposed a 100% tariff on Chinese goods, although Trump later suggested that such a measure may be unsustainable — yet still possible. Meanwhile, China imposed restrictions on rare earth metal exports but later assured its partners during IMF meetings that tighter export controls would not disrupt supply flows. Markets are now awaiting a highly anticipated meeting between the U.S. and Chinese presidents later this month in South Korea, amid cautious optimism from both sides.
Technical Outlook: Bearish Momentum May Continue for USD/CNH
From a technical perspective, indicators suggest the USD/CNH pair may continue to decline in the near term, based on the following factors:
- Death Cross: A bearish crossover continues between the 20-day moving average (gray) and the 50-day moving average (blue), indicating a downward trend.
- Relative Strength Index (RSI): Currently around 43 points, indicating bearish momentum.
- MACD: The blue MACD line is below the orange signal line, pointing to sustained negative momentum.
Please note that this analysis is provided for informational purposes only and should not be considered as investment advice. All trading involves risk.

