
The U.S. Dollar Index, which measures the dollar’s performance against a basket of six major currencies, fell yesterday to 101.27 points, marking its lowest level since October 2, 2024. Currently, the index is trading around 102.00 points and has declined by approximately 6% since the beginning of the year.
Major U.S. stock indices also closed with significant losses:
- S&P 500 hit 5,416 points yesterday, its lowest level since September 11, closing at 5,397 points, down 4.84% for the day. Since the beginning of the year, it has declined by 8%.
- Nasdaq 100 reached 18,503 points yesterday, its lowest level since September 9, closing at 18,521 points, down 5.41% for the day. Since the beginning of the year, it has declined by 12%.
- Dow Jones dropped to 40,391 points yesterday, its lowest since September 11, closing at 40,413 points, down 3.17% for the day. Since the beginning of the year, it has fallen by 5%.
- Russell 2000 recorded 1,904 points yesterday, its lowest since April 19, 2024, closing at 1,907 points, down 2.89% for the day. Since the beginning of the year, it has dropped by 16%.
Additionally, U.S. Treasury yields declined across different maturities. The 2-year Treasury yield, which is highly sensitive to Federal Reserve policy, fell to 3.690% yesterday, its lowest level since October 3, 2024. The 10-year Treasury yield, which is more influenced by U.S. fiscal policy, dropped to 4.002%, its lowest level since October 16, 2024. Notably, lower Treasury yields indicate higher bond prices, as these are considered safe-haven assets amid the ongoing trade war and uncertainty regarding the tariffs imposed by U.S. President Donald Trump on all countries. Markets are now anticipating potential responses or strategies from affected nations.
Markets are increasingly worried about the U.S. economy entering a recession or stagflation, particularly as tariffs are expected to negatively impact growth. Forecasts suggest that economic growth will slow down, while inflation could rise, complicating the Federal Reserve’s decision-making process regarding interest rates in the coming period.
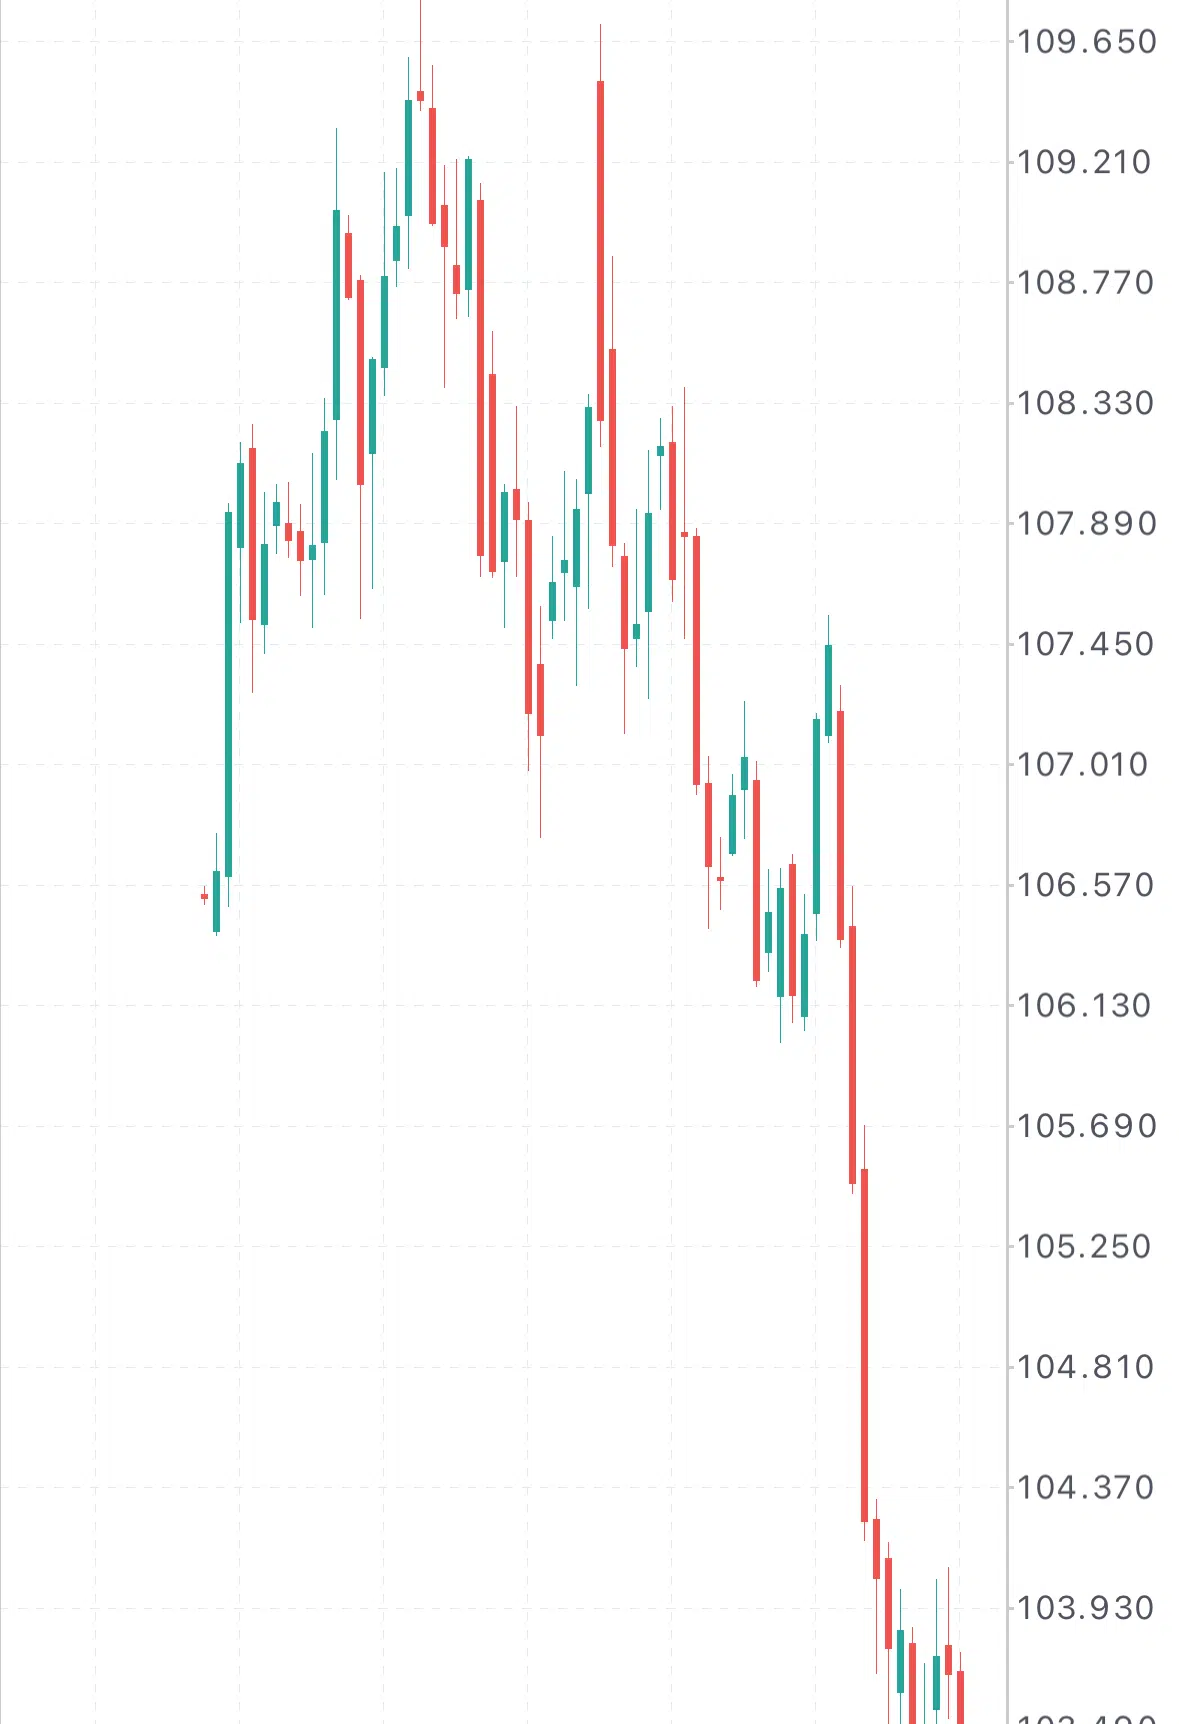
Technical Analysis:
The technical indicators suggest further downward pressure on the U.S. Dollar Index for the following reasons:
- Moving Averages Alignment: The 200-day, 50-day, and 20-day moving averages are aligned in a downward trend, with the 200-day average above the 50-day average and the 50-day average above the 20-day average.
- Relative Strength Index (RSI): Currently at 27 points, indicating oversold conditions, which reflect strong bearish momentum for the U.S. Dollar Index.
- Directional Movement Index (DMI): The Positive Directional Index (DMI+) stands at 9 points, while the Negative Directional Index (DMI-) is at 41 points, showing a significant gap between the two indicators. This suggests strong selling pressure on the U.S. Dollar.
- Average Directional Index (ADX): Currently at 32 points, indicating a strong bearish trend momentum.
Please note that this analysis is provided for informational purposes only and should not be considered as investment advice. All trading involves risk.


