
The USD/JPY pair continues its upward trend, reaching 151.99 today, the highest level since July 31, 2024. It is currently hovering around the 152.00 mark. The pair has increased by 9% since hitting a low of 139.57 on September 16, 2024, reaching today’s peak. It is up approximately 8% since the beginning of the year.
Several factors are putting pressure on the Japanese yen:
- Widening Yield Gap: The yield on Japanese 10-year government bonds is about 0.98%, while the yield on US 10-year Treasury bonds stands at approximately 4.23%. This creates a yield gap of about 3.25%, encouraging carry trade strategies.
- Expectations of No Further Rate Hikes: There are expectations that Japanese interest rates will not be raised for the third time this year. Japanese Prime Minister Shigeru Ishiba has stated that current economic conditions do not support another rate hike, emphasizing that the Bank of Japan is responsible for monetary policy details.
- Weak Economic Data: Japan’s export figures for September showed a contraction of 1.7%, lower than expectations (0.5%) and the previous reading (5.5%), marking the lowest level since February 2021. Additionally, imports grew by only 2.1%, which is below expectations (3.2%) and the prior reading (2.3%), representing the lowest level since March 2024.
Markets are awaiting the release of manufacturing and services PMI data from Japan and the US tomorrow, which may impact the USD/JPY pair.
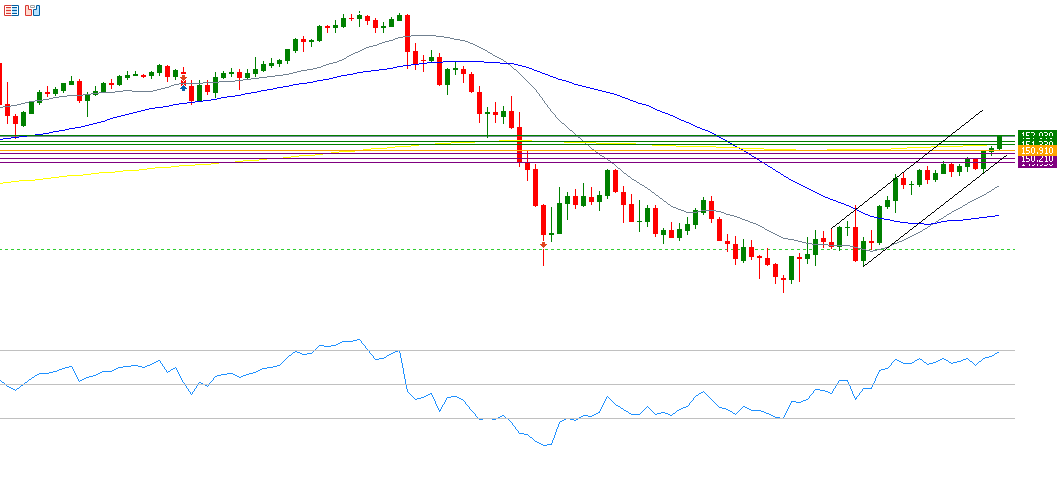
From a technical perspective, the bullish trend for the dollar against the yen seems to dominate in the near term. If the pivot point of 150.91 for the yen against the dollar is broken, there is a possibility that it will target support levels of 150.63, 150.21, and 149.93. On the other hand, if it surpasses the pivot point, it is likely to target resistance levels of 151.33, 151.61, and 152.03. The Relative Strength Index (RSI) currently stands at 73, in the overbought area, indicating bullish momentum for the USD/JPY pair.
Please note that this analysis is provided for informational purposes only and should not be considered as investment advice. All trading involves risk.


