CFDs are complex instruments and carry a high risk of rapid losses due to leverage. Leverage can magnify losses, and you may lose more than your initial investment. Ensure you understand the risks before trading. 

Location & Language

Taurex Global Limited regulated by the Financial Services Authority (FSA) of Seychelles (SD092)

French CAC40 Index: Navigating a Horizontal Range Amid Economic Weakness

Author:

Taurex

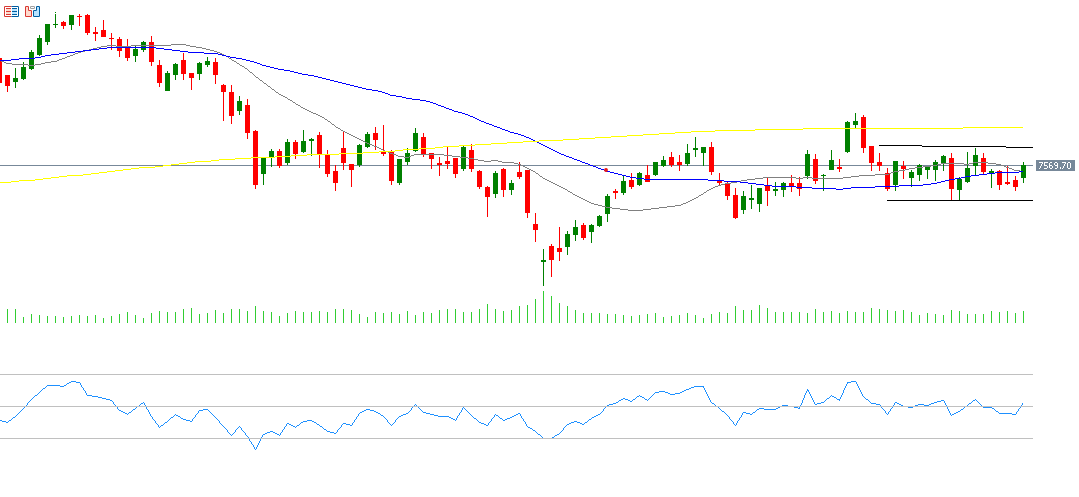
The French CAC40 index has been trading in a horizontal range since the beginning of October this year, between 7,420 and 7,655 points, without a clear direction. This index is still down by about 0.50% since the beginning of the year up to yesterday’s closing session, lagging behind both the German DAX index (which has risen by about 16%) and the British FTSE 100 index (which has risen by about 7%) as well as the European Stoxx 600 index (which has risen by about 9%).

Recent French economic data show that the French economy is facing weakness, as:

  • The industrial purchasing managers’ index (PMI) for October fell to 44.50 points, which is below expectations (44.9) and the previous reading (44.60).
  • The services purchasing managers’ index (PMI) for October fell to 48.30 points, which is below expectations (49.8) and the previous reading (49.60).
  • The trade balance in August recorded a deficit of €7.40 billion, which is a larger deficit than expected (-€5.5 billion) and the previous reading (-€6.0 billion).
  • The year-on-year consumer price index slowed down in September, recording 1.10%, which is lower than expectations (1.20%) and below the previous reading (1.80%).
  • The ratio of French debt to gross domestic product continues to rise, reaching levels above 120%, posing a significant challenge for French authorities to reduce this high ratio.

Markets are awaiting the release of the French GDP index on a quarterly basis on Wednesday, with expectations for a growth rate of 0.3%, surpassing the previous reading of 0.2%. On Thursday, the consumer price index in France will be released on a year-on-year basis, with expectations for a rate of 1.0%, which is lower than the previous reading of 1.1%.

From a technical perspective, there is a convergence between the 20-day moving average (in gray) standing at 7,544 points, and the 50-day moving average (in blue) also at 7,540 points as of October 28, 2024. Any bearish crossover between them may indicate the beginning of a downward trend for the CAC40 index.

As for the Relative Strength Index (RSI), it is at a neutral level (50 points), indicating ambiguity and a lack of clarity in the direction of the CAC40 index, whether upward or downward.

Please note that this analysis is provided for informational purposes only and should not be considered as investment advice. All trading involves risk.


Back

Taurex
Taurex brings a new perspective to trading - your confidence is our benchmark.
With a safe and secure trading ecosystem, diverse range of assets, comprehensive education, and advanced trading tools, Taurex empowers you to trade with confidence.

On this page

Ready for more?
Move to Taurex today

Popular Posts

Week Ahead with Connor Woods: NFP and the Dollar’s Relentless Bid

China’s Momenta Launches Hong Kong IPO, Signaling Strong Confidence in the Autonomous Driving...

Coffee & Charts with Connor: Why Gold Is Cracking and the Aussie Is...

Trade Radar: Three Post-FOMC Setups on the 15 Minute Chart

Here are some related articles you may find interesting:

Market Insights​

June 29, 2026

Week Ahead with Connor Woods: NFP and the Dollar’s Relentless...

June 29 – July 3, 2026 By Connor Woods, Global Head of Trading Education | 29 June 2026 Key Points • This week is one...

Market Insights​

June 29, 2026

China’s Momenta Launches Hong Kong IPO, Signaling Strong Confidence in...

Chinese autonomous driving technology company Momenta has officially launched its Hong Kong initial public offering (IPO), aiming to raise up to HK$5.89 billion (approximately USD751...

Market Insights​

June 24, 2026

Coffee & Charts with Connor: Why Gold Is Cracking and...

For most of the past nine months, gold and the Australian dollar have been telling the same story. When one moved, the other followed. But...

Market Insights​

June 23, 2026

Trade Radar: Three Post-FOMC Setups on the 15 Minute Chart

Key Points All three assets are in active selloffs following last week's hawkish FOMC meeting where the dot plot shifted to a 3.8% median year...

Ready to Elevate Your Trading Journey?

Open a Taurex account and start trading today.

Chat on WhatsApp

Live account Registration

1 Hour Trading Consultation

This site is registered on wpml.org as a development site. Switch to a production site key to remove this banner.