Location & Language

Taurex Global Limited regulated by the Financial Services Authority (FSA) of Seychelles (SD092)

Future Expectations for Gold Prices Amid Current Conditions

Gold prices reached $2,600 yesterday, the highest level ever recorded. This marks an increase of approximately 24% since the beginning of the year. Currently, it is trading near $2,560. It seems that the upward momentum for gold will prevail in the upcoming phase.

Let’s take a look at the factors supporting this rise:

  • The reduction of U.S. interest rates by the Federal Reserve yesterday from levels of 5.25% and 5.50% to levels of 4.75% and 5.00%, the first such reduction since March 2020, which increases the attractiveness of gold.
  • Ongoing geopolitical tensions in the Middle East and the Red Sea, as well as the Russia-Ukraine war, which increases the demand for gold as a safe haven.
  • Weak economic data from China, leading citizens and investors to purchase gold as a hedge against economic slowdown and deterioration in the real estate sector.
  • An increase in global central banks’ gold reserves.

It seems that technical indicators may support gold prices in the upcoming phase for several reasons:

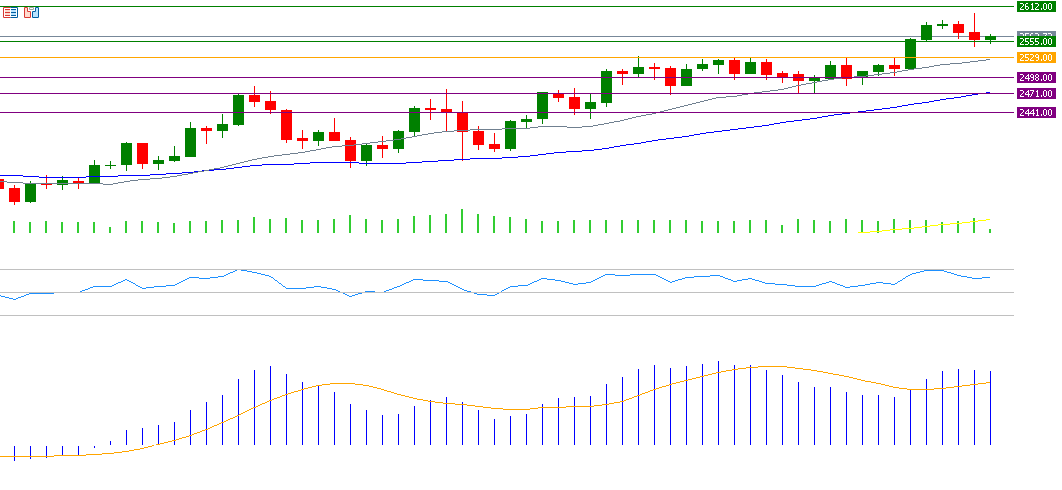
  1. The alignment of the 20-day, 50-day, and 200-day moving averages in an upward trend, where the 20-day average exceeds the 50-day average, and the 50-day average exceeds the 200-day average.
  2. The Relative Strength Index (RSI) currently registers 62 points, indicating upward momentum for the yellow metal.
  3. The MACD indicator, in blue, surpasses the SIGNAL LINE in orange and is also in the positive zone, providing positive momentum for the yellow metal.
  4. The Positive Directional Indicator (DMI+) records about 24 points compared to the Negative Directional Indicator (DMI-), which records approximately 16 points, indicating that buying pressures on gold are somewhat strong.


Please note that this analysis is provided for informational purposes only and should not be considered as investment advice. All trading involves risk.

Back

Popular Posts

The Chinese yuan between improving economic data and continued pressure in the real...

Brief Overview of Last Week’s Key Economic Events

Gold Prices Trading Sideways Amid a Strong Dollar and Rising Bond Yields

Derivatives as a Tool for Hedging and Risk Management Amid Current Severe Volatility...

Here are some related articles you may find interesting:

Market Insights​

March 17, 2026

The Chinese yuan between improving economic data and continued pressure...

The US dollar against the Chinese yuan has been trading since the beginning of March until today within a horizontal range between 6.8600 and 6.9400,...

Market Insights​

March 16, 2026

Brief Overview of Last Week’s Key Economic Events

Last week witnessed the release of several important economic data points that reflected a mixed picture of the global economy. In the United States, data...

Market Insights​

March 13, 2026

Gold Prices Trading Sideways Amid a Strong Dollar and Rising...

Gold prices have been trading within a horizontal range between $5,000 and $5,200 over the past week until today. The strength of the US dollar...

Market Insights​

March 12, 2026

Derivatives as a Tool for Hedging and Risk Management Amid...

Global financial markets, including equities, bonds, commodities, currencies, and crypto, are currently experiencing significant volatility due to several factors, including: • Geopolitical tensions, particularly the...

Ready to Elevate Your Trading Journey?

Open a Taurex account and start trading today.

Chat on WhatsApp

Live account Registration

1 Hour Trading Consultation

This site is registered on wpml.org as a development site. Switch to a production site key to remove this banner.