
Gold prices reached $2,763 yesterday, marking the highest level since October 31, 2024, when it reached $2,790, its all-time high. It is currently trading near the $2,760 level. Gold has risen by about 9% since the low of November 14, 2024, when it was at $2,537, reaching the peak of $2,763 yesterday. It has also risen about 5% since the beginning of the year. The biggest challenge now is for gold to reach and surpass the $2,790 level.
Factors supporting gold prices include, but are not limited to:
- Central Bank Gold Purchases: Ongoing gold buying by central banks, especially the People’s Bank of China. Additionally, Chinese citizens continue to buy gold as a hedge against economic uncertainty in China.
- U.S. Inflation: U.S. inflation remains persistent, with the Consumer Price Index (CPI) rising 2.9% year-over-year in December, in line with analysts’ expectations but higher than the November reading of 2.7%. This supports gold as a hedge against inflation.
- Geopolitical Tensions: The ongoing Russia-Ukraine war, along with the potential for further tensions, could positively affect gold prices as it remains a traditional safe-haven asset.
- Trade Tensions: Anticipation of trade tensions between the U.S. and other countries such as Mexico, Canada, China, and the European Union. President Trump announced the imposition of tariffs of 25% on goods imported from Mexico and Canada, and 10% on China starting February 1. He also threatened the EU with tariffs unless they purchase oil and gas from the U.S.
- Interest Rates: A 100 basis points reduction in U.S. interest rates last year, with expectations of further cuts this year, which could have a positive impact on gold.
- Rising U.S. Debt: U.S. debt has surpassed $36 trillion, and projections suggest it will continue to rise.
From a technical perspective, indicators suggest that gold prices may continue to rise for the following reasons:
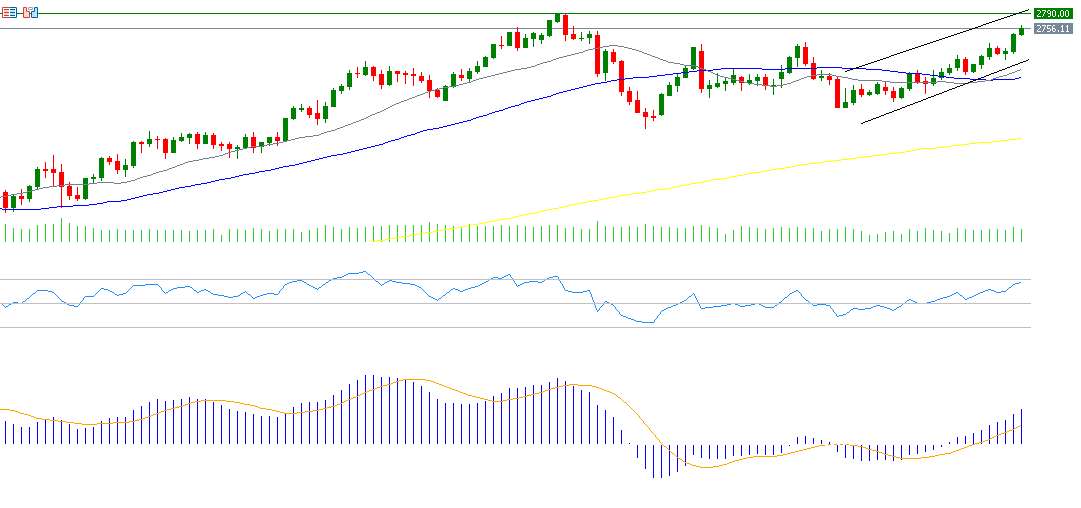
- Golden Cross: The 20-day moving average (gray line), currently around $2,669, has crossed above the 50-day moving average (blue line), which is around $2,649. This suggests a bullish trend for gold.
- Relative Strength Index (RSI): Currently at 67, the RSI indicates bullish momentum for the yellow metal.
- MACD Indicator: The MACD (blue line) has crossed above the signal line (orange line), indicating continued upward momentum for gold.
Please note that this analysis is provided for informational purposes only and should not be considered as investment advice. All trading involves risk.


