
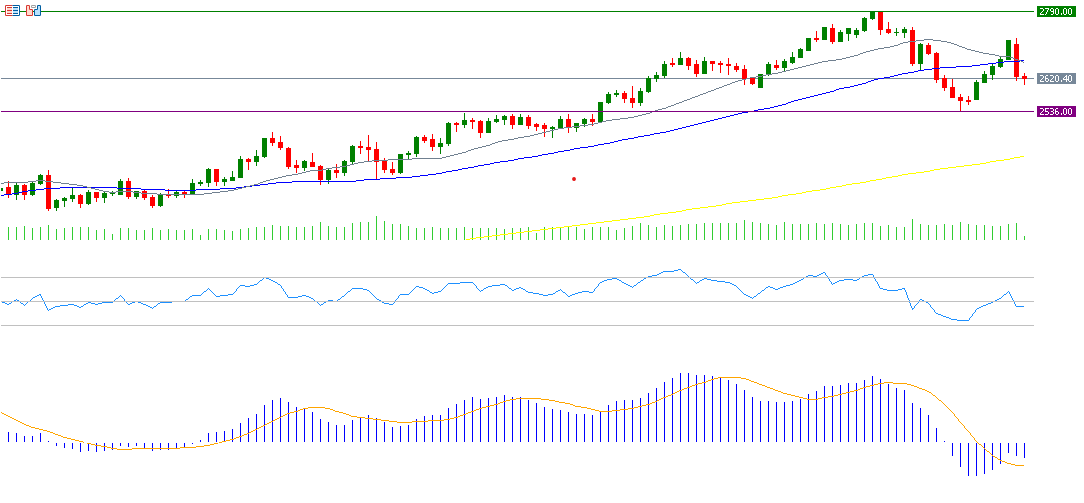
Gold prices have been experiencing fluctuations recently, reaching a record high of $2,790 on October 30 of this year, before falling to $2,536 on November 14, 2024. Currently, gold is trading near $2,600. We can observe that gold prices are moving within two key levels: a support level around $2,500 and a resistance level near $2,800. Since the beginning of the year, gold prices have risen by about 27%. The outlook for gold in the near future remains uncertain, as it is unclear whether prices will rise or fall.
Factors supporting gold prices include, but are not limited to:
- Inflation in the United States: Inflation remains persistent in the U.S., with figures surpassing analyst expectations, which supports gold as a hedge against inflation.
- Geopolitical Tensions: The escalation of geopolitical tensions between Russia and Ukraine, coupled with fears of the conflict expanding into a potential Third World War, may positively affect gold prices as it is considered a traditional safe haven.
- Gold Purchases by Central Banks: Central banks continue to buy gold, which is expected to persist in the coming period.
Factors putting pressure on gold prices include, but are not limited to:
- Strength of the U.S. Dollar: The U.S. dollar, measured against a basket of six major currencies, has strengthened due to Donald Trump’s presidency, the resilience of the U.S. economy, and better-than-expected economic data. Additionally, recent statements from Federal Reserve Chairman Jerome Powell about not rushing to cut interest rates have affected gold negatively. The likelihood of a 25 basis point rate cut has decreased, with markets now pricing in only a 57% chance of such a cut in the upcoming Federal Reserve meeting on December 18.
- Easing Geopolitical Tensions in the Middle East: Discussions about a ceasefire agreement between the conflicting sides have reduced tensions.
From a technical perspective, the indicators suggest pressure on gold for the following reasons:
- The convergence of the 20-day moving average (gray line) at $2,662 and the 50-day moving average (blue line) at $2,665. A downward crossover between these two averages could signal a negative outlook for gold.
- The Relative Strength Index (RSI) currently stands at 46, indicating bearish momentum for the yellow metal.
- The Commodity Channel Index (CCI) is currently around -54, indicating that negative momentum is prevailing for gold.
Please note that this analysis is provided for informational purposes only and should not be considered as investment advice. All trading involves risk.


