By Camilo Botia,
Wall Street experienced a sharp downturn after hotter-than-expected inflation data and renewed geopolitical tensions sent investors scrambling. The persistent rise in prices dashed expectations of near-term interest rate cuts by the Federal Reserve, sparking concern the central bank will maintain a hawkish stance well into 2024.
The S&P 500 extended its April losses, shedding about 1%, while Treasury yields surged amid a repricing of expectations. As markets digest the possibility of a “higher-for-longer” interest rate environment, analysts warn of further headwinds for stocks and a potential slowdown in the much-hoped-for Fed easing cycle.
The March core consumer price index (CPI), a key inflation gauge, rose 0.4% from February and 3.8% year-over-year, exceeding forecasts. The data underscores the Fed’s fight against inflation is far from over. Bond markets reacted swiftly, with 10-year Treasury yields topping 4.5%, while rate-sensitive sectors like technology took a hit.
Growing speculation that the Fed could hike rates further, coupled with geopolitical jitters due to rising tensions in the Middle East, further dampened market sentiment. Oil prices initially tumbled but then rebounded, adding to the day’s volatility.
Minutes from the latest Fed meeting indicate policymakers see an eventual pivot; however, the timing is now significantly less certain. Economists widely differ in their outlook, with some foreseeing a July cut as probable, but some caution that path dependency could complicate the Fed’s actions later in the year.
While inflation is stubbornly high, some strategists see hope for cuts later in the year.
The market’s early-year optimism is undergoing a reality check. A resilient labour market, stubborn inflation, and a hawkish Fed point towards a potentially protracted period of high interest rates. Investors should expect continued volatility as they weigh the implications for economic growth and asset valuations.
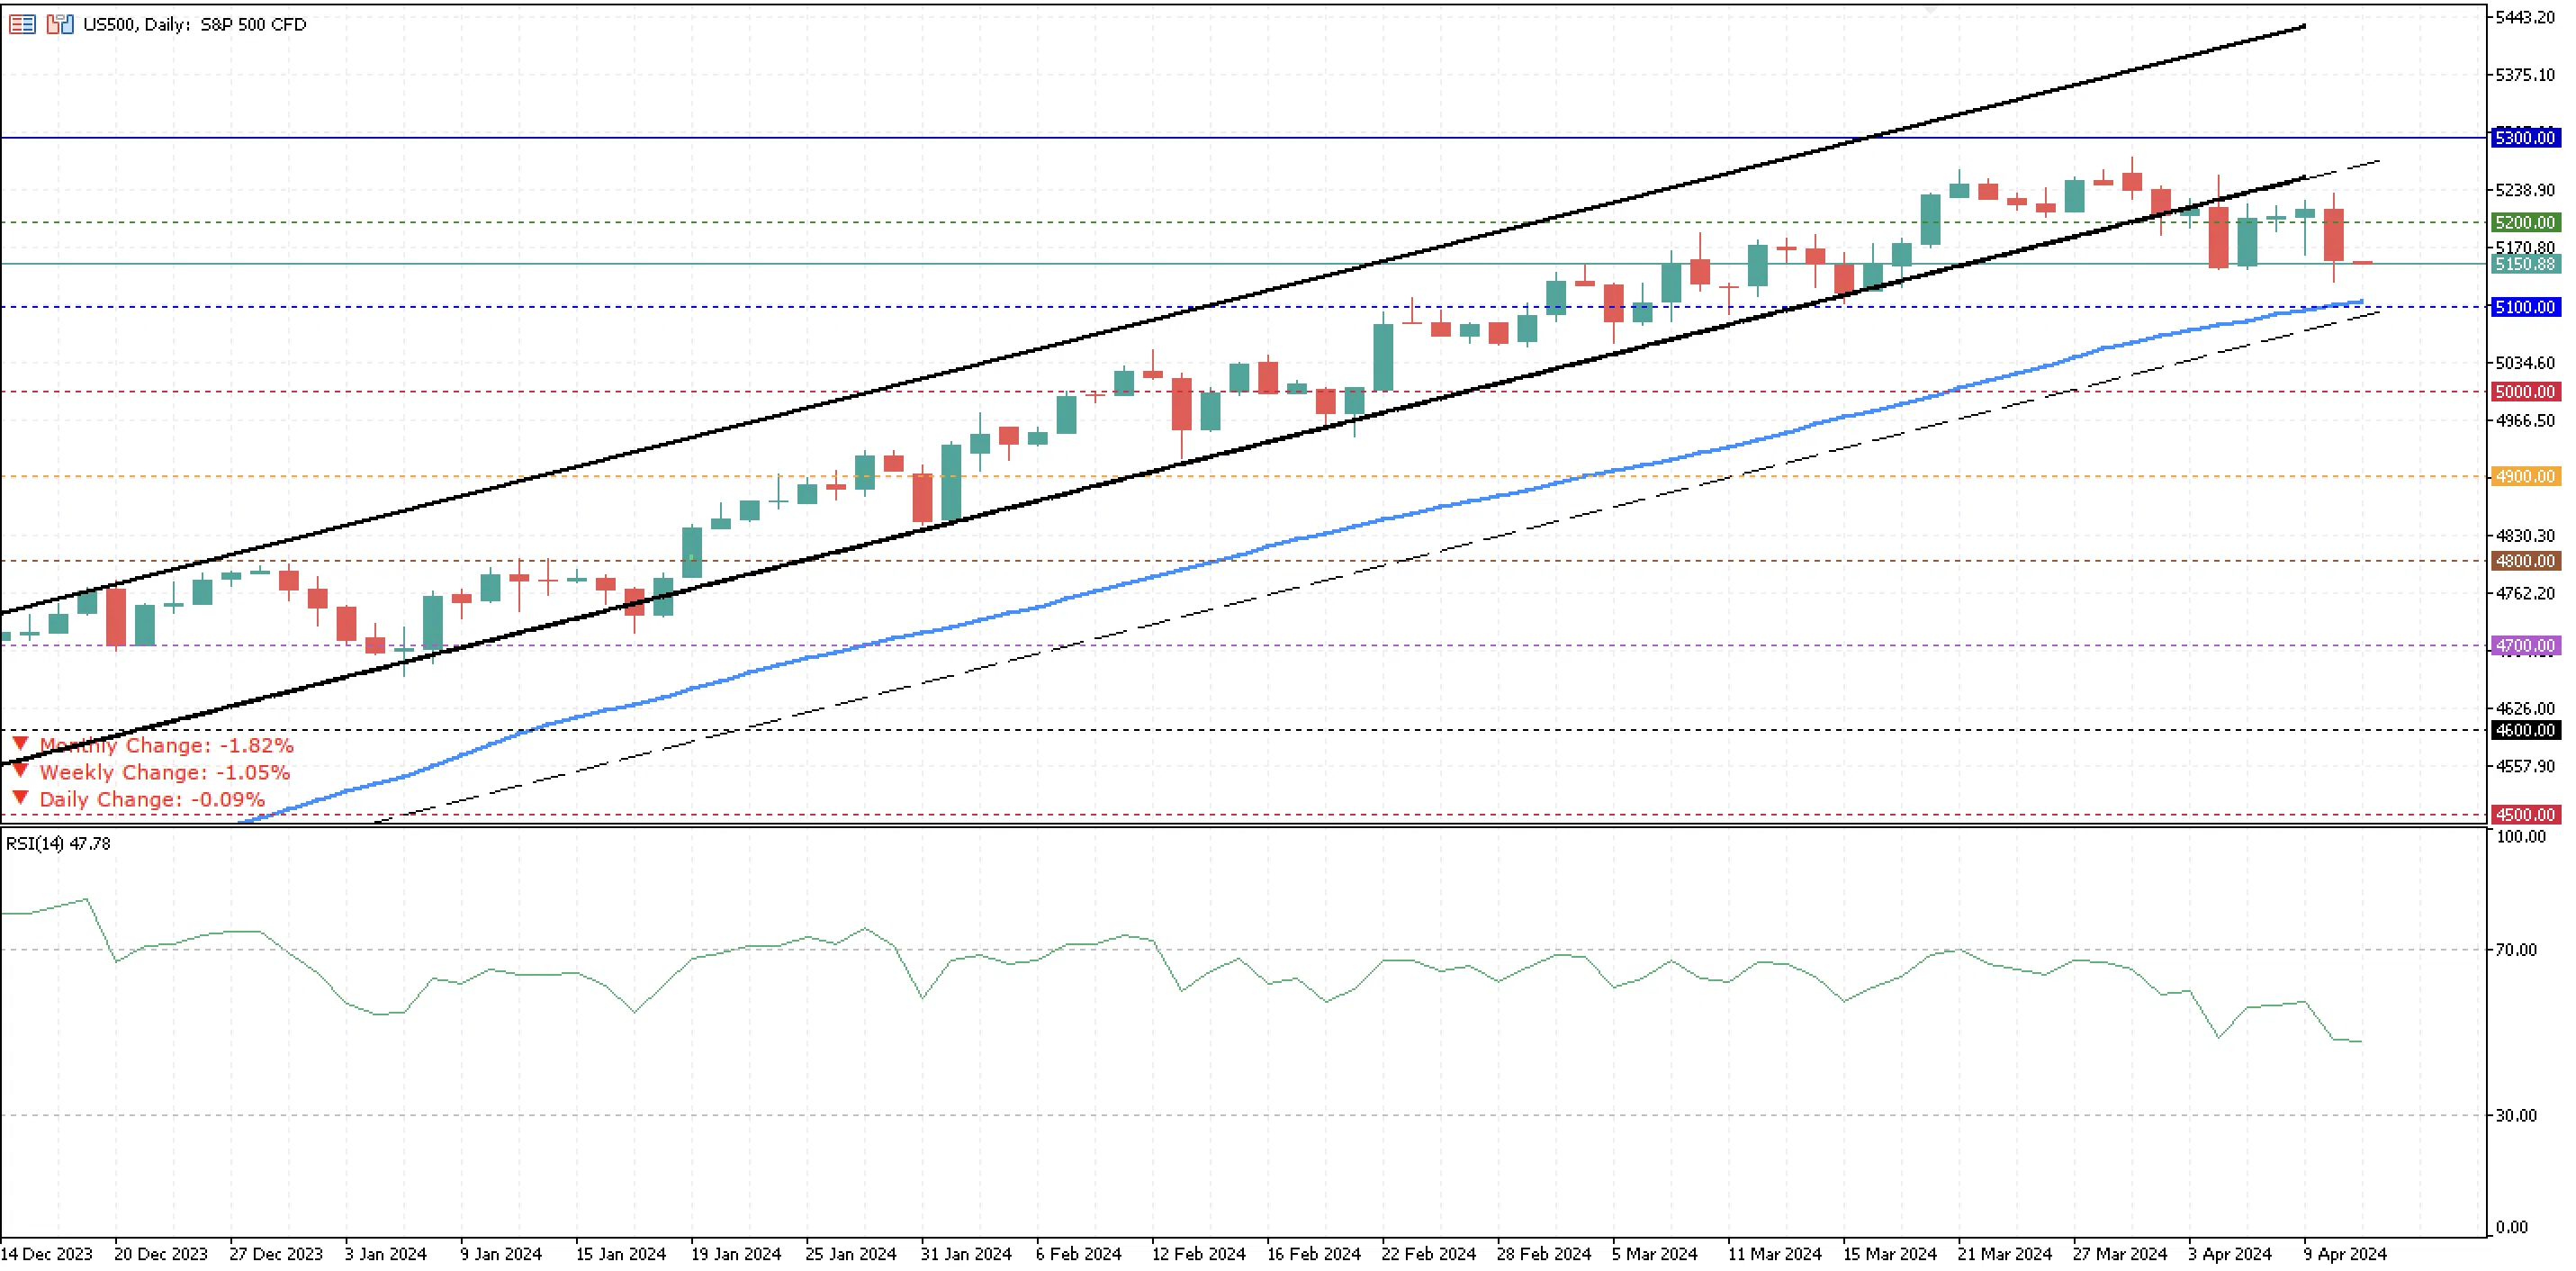
The US500 is now trading below 5,200, and it’s getting closer to its next significant support at the 50-day moving average. Also, there is a second key level to monitor, the lower boundary of the projection of the previous bullish channel the S&P was trading at, which is around 5,100. So far during the month, the Index has lost 1.82% and might be in a consolidating phase around 5,150. The RSI oscillator shows a small increase in the bearish momentum caused by the significant decrease in stocks on Wednesday.


