
The USD/JPY pair continues its upward trend, reaching 149.19 on Wednesday, July 16 — the highest level since April 3, 2025. It is currently trading near the 149.00 mark. The pair has gained 5% since its recent low on July 1, 2025, when it touched 142.68. However, it remains down by about 6% since the beginning of the year.
Several key factors are weighing on the Japanese yen:
- Upcoming parliamentary elections in Japan, scheduled for July 20, are causing market uncertainty. Expectations are mounting that the ruling Liberal Democratic Party may lose ground, with opposition parties gaining traction by promising attractive policies such as tax cuts and increased public spending. However, Japan’s high public debt — around 250% of GDP — remains a major concern, raising fears of worsening fiscal sustainability.
- Rising yields on Japanese government bonds, especially long-term ones, have reached very high levels due to weak demand and increased supply. Additionally, the Bank of Japan has recently sold a significant amount of government bonds, adding pressure to the bond market. The total value of these bonds is estimated at approximately $7.7 trillion.
- Weak Japanese economic data, including a 0.5% year-on-year decline in exports, which is below both the forecast (0.5%) and the previous reading (-1.7%). Industrial production also contracted by 0.1% year-on-year, which is lower than the expected 0.5%, though better than the previous figure of -1.1%.
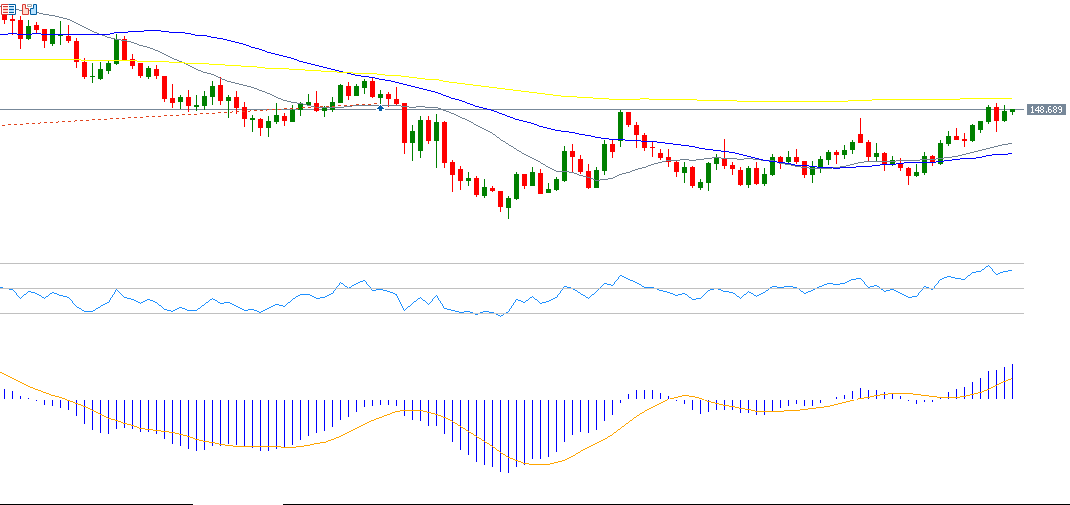
From a technical perspective, the bullish trend for USD/JPY appears to be dominant in the short term. If the pair breaks below the pivot point at 148.42, it may target support levels at 147.74, 147.04, and 146.36. However, if the pivot is breached to the upside, the pair could aim for resistance levels at 149.12, 149.80, and 150.50.
The Relative Strength Index (RSI) is currently at 65, reflecting strong bullish momentum. Additionally, the MACD (blue line) shows a positive crossover above the signal line (orange line), further reinforcing the positive outlook for the pair.
Please note that this analysis is provided for informational purposes only and should not be considered as investment advice. All trading involves risk.

