
The U.S. dollar continues its downward trend against the Mexican peso, recording 18.4584 yesterday — its lowest level since August 1, 2024. The pair has dropped by about 12% since reaching its peak on April 9, 2025, at 21.0785, down to the recent low of 18.4584. It has also declined nearly 10% year-to-date and is currently hovering around 18.7700.
Recent economic data from Mexico shows that the economy remains resilient:
- The annual Consumer Price Index (CPI) in June came in at 4.32%, slightly above expectations of 4.31%.
- The unemployment rate dropped to 2.70% in June, better than the expected 2.80%.
- The Industrial Production Index rose by 0.6% month-over-month, outperforming expectations of -0.1% and the previous reading of 0.2%.
A key driver behind the USD/MXN downward trend is the broad weakness of the U.S. dollar against most global currencies, particularly emerging market currencies.
In addition, Mexico’s central bank interest rate stands at 8%, significantly higher than the U.S. Federal Reserve’s rate of 4.50% — a 3.50% spread. This rate differential makes peso-denominated assets more attractive, supporting continued investment flows into Mexican bonds at the expense of U.S. bonds, which has given the Mexican peso additional momentum.
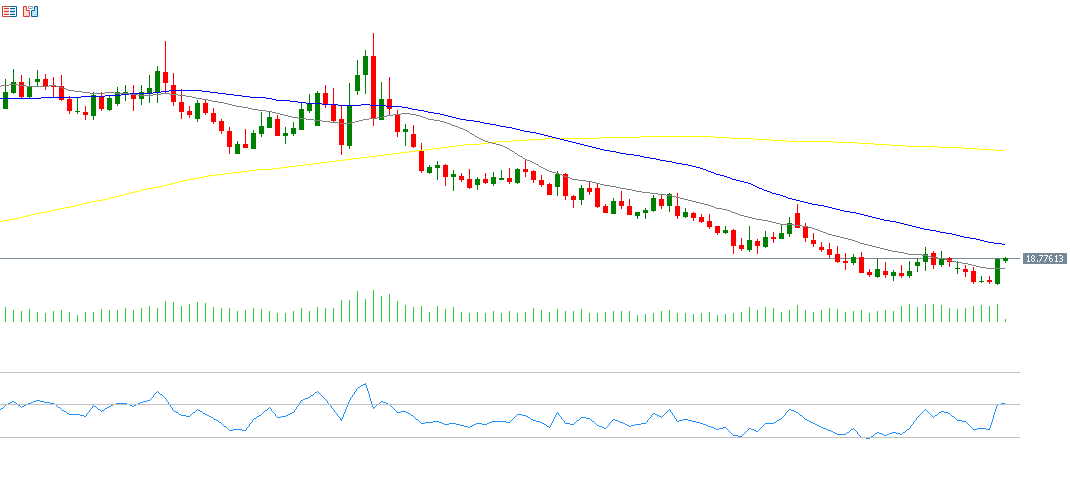
From a technical perspective, if the pivot point of 18.6839 in the USD/MXN pair is broken to the downside, the price may head toward the next support levels at 18.5883, 18.4146, and 18.3190. Conversely, a move above the pivot could target resistance levels at 18.8576, 18.9532, and 19.1269. The Relative Strength Index (RSI) is currently at 48, indicating bearish momentum for the USD/MXN pair.
Please note that this analysis is provided for informational purposes only and should not be considered as investment advice. All trading involves risk.

