
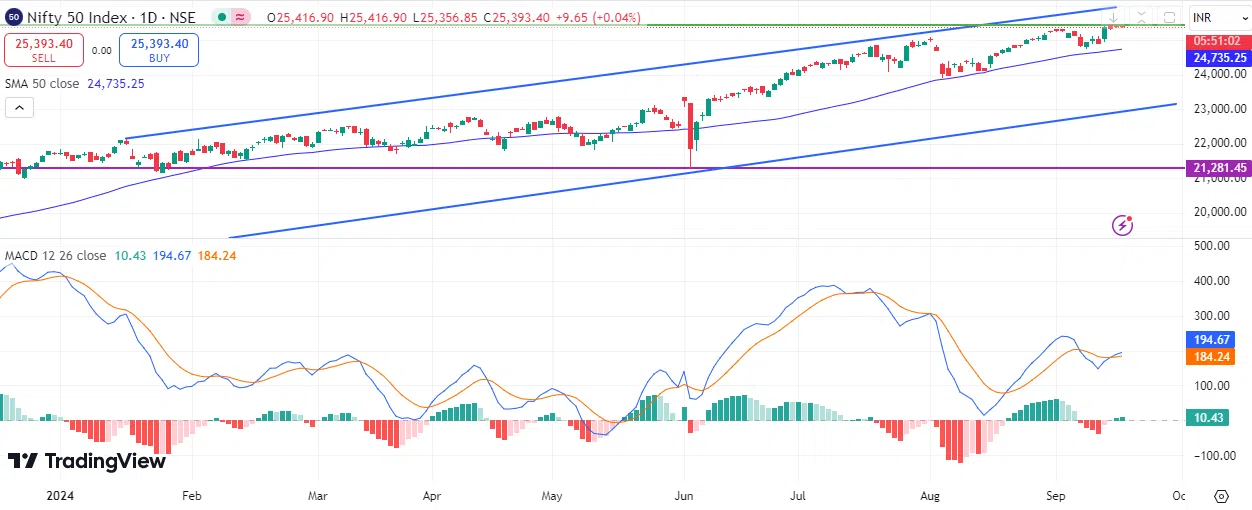
The Indian Nifty50 Index continues its upward trajectory, having reached a record high of 25,445 points yesterday. This marks an increase of approximately 20% since the low of June 4, 2024, when it stood at 21,281 points, up to yesterday’s session. It has also risen by about 17% since the beginning of the year to date. It is currently trading near the 25,400-point level.
Recent Indian economic data shows that the Indian economy is truly resilient, as:
- The Industrial Production Index grew by 4.8% year-on-year in July, surpassing both expectations and the previous reading of 4.7%.
- The Services Purchasing Managers’ Index (PMI) for July increased to 60.9 points, exceeding expectations of 60.4 and the previous reading of 60.3.
- India’s foreign exchange reserves rose to 689.24 billion USD, surpassing the previous reading of 683.99 billion USD.
The Consumer Price Index (CPI) in India recorded a 3.65% annual increase in August, which exceeded expectations of 3.55% and the previous reading of 3.60%. This figure is below the Reserve Bank of India’s target rate of 4%, which might encourage the central bank to start reducing interest rates in the near future. This could help attract more foreign investments to the country.
Interest rates in India have remained steady at 6.50% since February 2023, as set by the Reserve Bank of India.
Despite Indian stocks reaching record levels and high price-to-earnings ratios of around 23 times, the upward trend in Indian stocks appears to be prevailing, especially with expectations of continued foreign investment flows into Indian markets.
Technical indicators seem to support the Nifty50 Index in the near term for several reasons:
- First: The Relative Strength Index (RSI) currently stands at 64 points, indicating bullish momentum for the Nifty50 Index.
- Second: A bullish crossover between the MACD (Moving Average Convergence Divergence) in blue and the Signal Line in orange occurred in the positive zone on Friday, September 13, 2024, signaling upward momentum for the Nifty50 Index.
- Third: The 20-day, 50-day, and 200-day moving averages are aligned in an upward trend, with the 20-day average surpassing the 50-day average, and the 50-day average exceeding the 200-day average.
Please note that this analysis is provided for informational purposes only and should not be considered as investment advice. All trading involves risk.


