
The USD/JPY currency pair rose today, reaching 150.68, the highest level since August 1, 2025, and is currently trading above the 150.50 level. The pair has increased by 4% since the low recorded on September 17, 2025, at 145.48, reaching the peak achieved today at 150.68. However, the pair is still down by about 4% since the beginning of the year to date.
Meanwhile, the Nikkei 225 index continues its upward trajectory, recording an all-time high of 48,527 points today. The index has risen by approximately 58% since its lowest point on April 7 this year, when it stood at 30,793 points, up to its peak today. It has also gained about 20% since the start of 2025. Additionally, the TOPIX index also hit record levels at 3,248 points today, marking an increase of around 16% from the beginning of the year.
This remarkable rise in Japanese stocks is attributed to several factors, most notably:
- The victory of Sanae Takaishi in the leadership election of the Liberal Democratic Party over the past weekend, known for supporting accommodative monetary and fiscal policies, i.e., backing high government spending and easy borrowing to revive the sluggish economy. This complicates the Bank of Japan’s task of controlling inflation and raises doubts about hiking interest rates.
- The weakness of the Japanese yen, which is currently trading above the 150.50 yen per US dollar level, encouraging foreign investors to inject funds into Japanese markets.
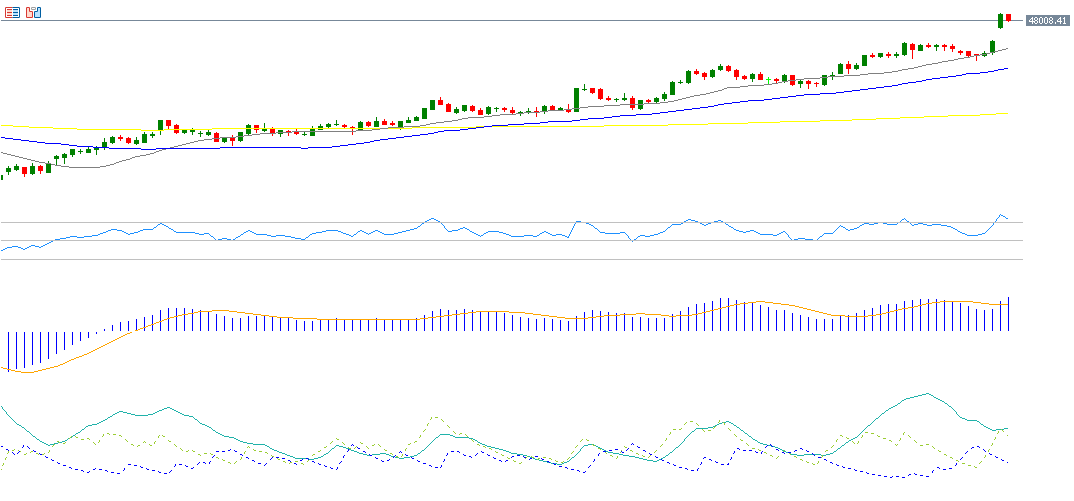
From a technical perspective, indicators suggest the potential continuation of the Nikkei 225’s rise for the following reasons:
- A clear upward trend in the 20-day, 50-day, and 200-day moving averages, with the 20-day moving average crossing above the 50-day, and the 50-day crossing above the 200-day.
- The Relative Strength Index (RSI) currently stands at 77, placing it in the overbought zone, indicating strong upward momentum.
- The MACD indicator shows a bullish crossover between the MACD line (blue) and the signal line (orange), providing momentum to the Nikkei 225.
- The Positive Directional Indicator (DMI+) records around 53 points, compared to the Negative Directional Indicator (DMI-) at about 13 points. The wide gap between these two indicators signifies strong buying pressure on the Nikkei 225. Most importantly, the Average Directional Index (ADX) is around 37 points, indicating a strong momentum for this upward trend.
Please note that this analysis is provided for informational purposes only and should not be considered as investment advice. All trading involves risk.

