Location & Language

Taurex Global Limited regulated by the Financial Services Authority (FSA) of Seychelles (SD092)

Oil Falls 16% Year-to-Date Amid Economic and Trade Concerns

Author:

Taurex

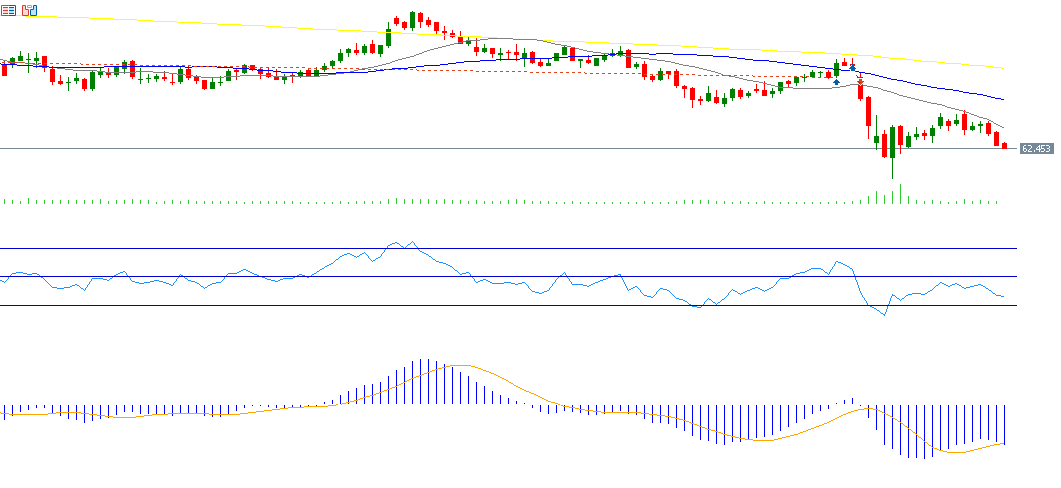
Oil prices dropped to $62.40 today, marking their lowest level since April 10, 2025, and are currently trading near $62.50. Prices have declined by around 16% since the beginning of the year, amid ongoing uncertainty in the oil market, which is being driven by several conflicting factors. Notably, crude oil prices reached as low as $58.44 on April 9, 2025—the lowest level since February 2021.

This decline is attributed to several key factors, including:
• OPEC+’s decision to return 411,000 barrels per day to the market—significantly higher than expectations of just 135,000 barrels.
• Uncertainty surrounding tariffs imposed by Trump on various countries, especially China, and the retaliatory measures.
• Concerns over a potential economic recession in the United States.
• Oversupply in the global oil market.

From a technical perspective, indicators suggest continued bearish momentum for oil prices due to the following:

  • The 200-day, 50-day, and 20-day moving averages are aligned in a downward trend, with the 200-day above the 50-day, and the 50-day above the 20-day average.
    • The Relative Strength Index (RSI) is currently at 37, indicating bearish momentum.
    • The MACD line (blue) is converging with the Signal Line (orange), and any downward crossover between the two could further reinforce the negative momentum in crude oil prices.

Please note that this analysis is provided for informational purposes only and should not be considered as investment advice. All trading involves risk.

Back

Taurex
Taurex brings a new perspective to trading - your confidence is our benchmark.
With a safe and secure trading ecosystem, diverse range of assets, comprehensive education, and advanced trading tools, Taurex empowers you to trade with confidence.

On this page

Ready for more?
Move to Taurex today

Popular Posts

Under the Microscope: Palladium Edition

Coffee & Charts with Connor: The Oil and CAD Correlation Is Lying to...

Trade Radar: Gold Trapped, S&P Coils, and GBP/JPY Fires Off Demand

Week Ahead with Connor Woods: Warsh Takes the Reins as FOMC Minutes and...

Here are some related articles you may find interesting:

Market Insights​

May 21, 2026

Under the Microscope: Palladium Edition

Key Points Palladium has fallen 37% from its January high of $2,200 to $1,386 and the daily chart structure is firmly bearish, with multiple Break...

Market Insights​

May 20, 2026

Coffee & Charts with Connor: The Oil and CAD Correlation...

Key Points The traditional inverse correlation between crude oil and USD/CAD has broken down repeatedly since the Hormuz crisis began, with both assets moving in...

Market Insights​

May 19, 2026

Trade Radar: Gold Trapped, S&P Coils, and GBP/JPY Fires Off...

Key Points Gold is trapped beneath a descending trendline and the $4,740 to $4,760 supply zone. A rejection from trendline resistance near $4,620 to $4,640...

Market Insights​

May 18, 2026

Week Ahead with Connor Woods: Warsh Takes the Reins as...

Key Points The FOMC minutes from Powell's final meeting land on Wednesday, revealing how deeply the committee was split when it voted 8 to 4...

Ready to Elevate Your Trading Journey?

Open a Taurex account and start trading today.

Chat on WhatsApp

Live account Registration

1 Hour Trading Consultation

This site is registered on wpml.org as a development site. Switch to a production site key to remove this banner.