
Crude oil prices continue to decline for the third consecutive session, recording $74.10 yesterday after reaching $77.25 three days ago. Currently, oil prices are hovering near $75.00 amid prevailing uncertainty in the oil market, which is influenced by several mixed factors.
Positive Factors Supporting Oil Prices:
- The voluntary production cuts by the OPEC+ alliance, reducing output by 2.2 million barrels per day until the end of March this year.
- The anticipated stimulus measures from Chinese authorities, aimed at reviving the economy of the world’s largest oil importer.
Factors Limiting Oil Price Gains:
- U.S. crude oil inventories increased by 4.070 million barrels, exceeding expectations of 2.400 million barrels but lower than the previous reading of 8.664 million barrels.
- Talks of ending the Russia-Ukraine war, especially with former President Donald Trump mediating between the two conflicting nations.
- A stronger U.S. dollar, which generally exerts downward pressure on oil prices.
- Shifting market expectations regarding the Federal Reserve’s rate cuts, now anticipating only one rate cut instead of two this year. This shift is driven by strong U.S. economic performance and persistent inflation, along with Federal Reserve Chair Jerome Powell’s remarks suggesting that interest rates will remain high for the foreseeable future.
Technical Analysis:
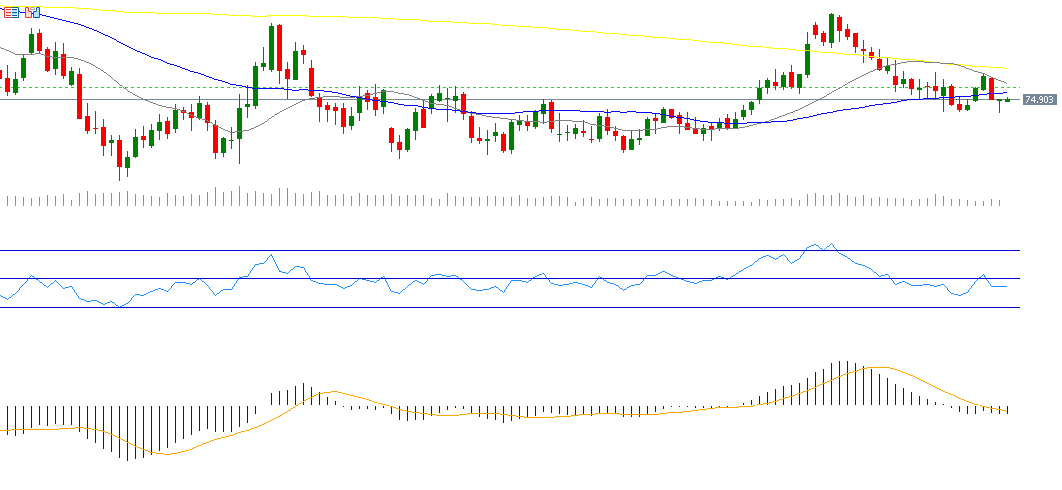
Currently, crude oil prices are trading below the 50-day moving average (blue) at $75.75, as well as the 20-day moving average (gray) at $76.79. Additionally, there is a narrowing gap between the 20-day and 50-day moving averages, and any bearish crossover between them could indicate further downside pressure on oil prices.
Regarding the Relative Strength Index (RSI), it is currently at 45, signaling bearish momentum for crude oil prices. Furthermore, the MACD indicator shows the blue line below the Signal Line (orange), reinforcing continued downside momentum for oil prices.
Please note that this analysis is provided for informational purposes only and should not be considered as investment advice. All trading involves risk.


