
Crude oil prices continue to face selling pressure, having declined for the fourth consecutive month. Prices recently touched $60.96 two days ago — the lowest level since October 21, 2025 — and are currently hovering around $62. Despite this, prices have remained within a narrow range between $60 and $70 per barrel since early August, amid an environment of uncertainty driven by mixed market factors. Overall, oil prices have fallen by about 17% since the start of the year.
Key downward pressures on crude oil prices include:
• A potential breakthrough toward ending the Russia–Ukraine war, following ongoing negotiations between the United States and Ukraine regarding peace with Russia. U.S. President Donald Trump stated that “huge progress” has been made and that Witkoff and Kushner will meet Russian President Vladimir Putin next week.
• Ample oil supply from non-OPEC+ producers.
• Weak economic data from major oil importers such as China, weighing on global demand for crude.
• A rise in Iranian oil shipments stored offshore, reaching their highest level since 2023.
- U.S. crude oil inventories rose by 2.774 million barrels last week, exceeding expectations of -1.300 million barrels and coming in above the previous reading of -3.426 million barrels.
On the other hand, supportive factors for oil prices include:
• Market expectations for a 25-basis-point rate cut by the U.S. Federal Reserve at the December 10 meeting, with an 80% probability — a move that could boost oil demand.
• Weakness in the U.S. dollar, which typically provides upward momentum for oil prices due to the inverse relationship between the two, alongside expectations for further dollar declines in the coming period.
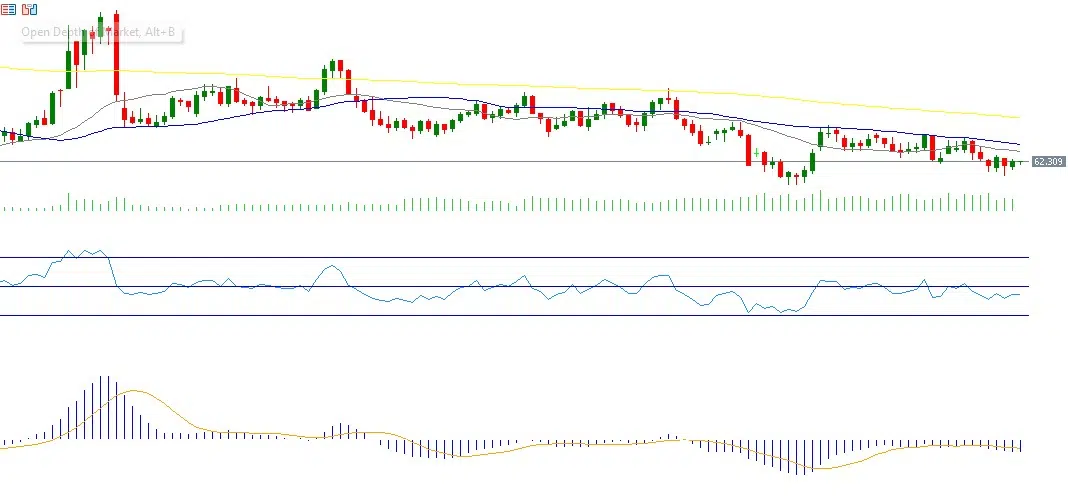
Technically, crude oil is trading below major support levels:
• The 50-day moving average (blue), currently at $64.37
• The 20-day moving average (gray), currently at $63.56
The next key challenge is whether oil prices will drop toward the psychological support level at $60. A break below this threshold could pave the way toward the next downside target at $58.50 — the level last seen on April 9, 2025.
The Relative Strength Index (RSI) currently stands at 43, indicating negative momentum. Additionally, a bearish crossover is visible between the MACD line (blue) and the signal line (orange), reinforcing the likelihood of continued selling pressure in crude oil.
Please note that this analysis is provided for informational purposes only and should not be considered as investment advice. All trading involves risk.

