
Last week witnessed the release of several major global economic indicators. In the United States, data showed a slowdown in some metrics, with the Core Personal Consumption Expenditures (PCE) Price Index rising by 2.5%, while the GDP contracted by 0.2%. Pending home sales and crude oil inventories declined, whereas consumer confidence increased. In Canada, the Ivey PMI dropped. In New Zealand, the Reserve Bank cut interest rates by 25 basis points. In Japan, monthly industrial production declined, while consumer prices in Tokyo rose. Meanwhile, in China, both the manufacturing and non-manufacturing PMIs came in below expectations, indicating a relative slowdown in economic activity.
Market Analysis
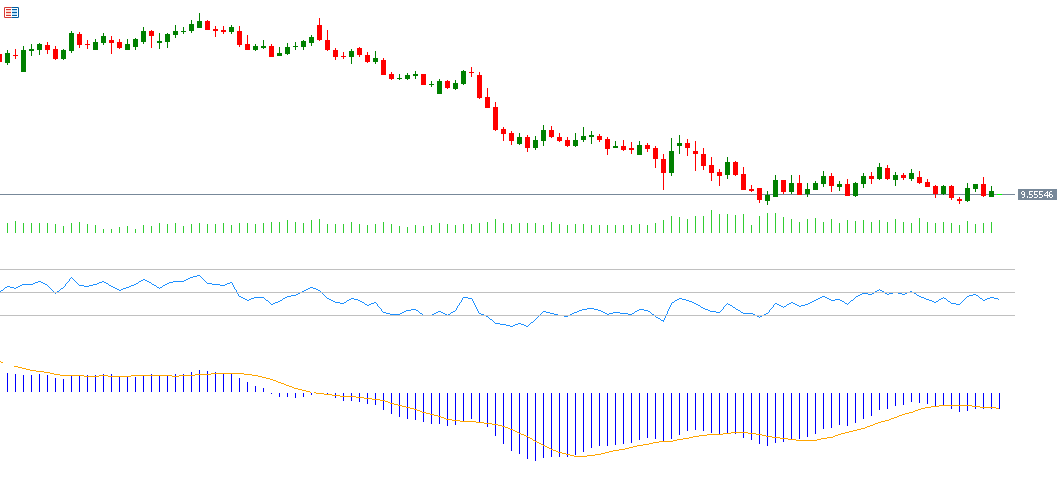
USD/SEK Pair
The USD/SEK pair continues its downward trend, hitting 9.4641 last week — its lowest level since April 22, 2022. The pair has dropped around 16% from its peak on January 13, 2025 (11.3216), down to its recent low of 9.4641. Year-to-date, it has fallen by approximately 13% and is currently trading near 9.5700. The strength of the Swedish krona is attributed to strong economic data and a weaker U.S. dollar. The Relative Strength Index (RSI) currently reads 45, indicating continued bearish momentum for the pair. The MACD also shows a bearish crossover between the MACD line (blue) and the signal line (orange), reinforcing the downward momentum.
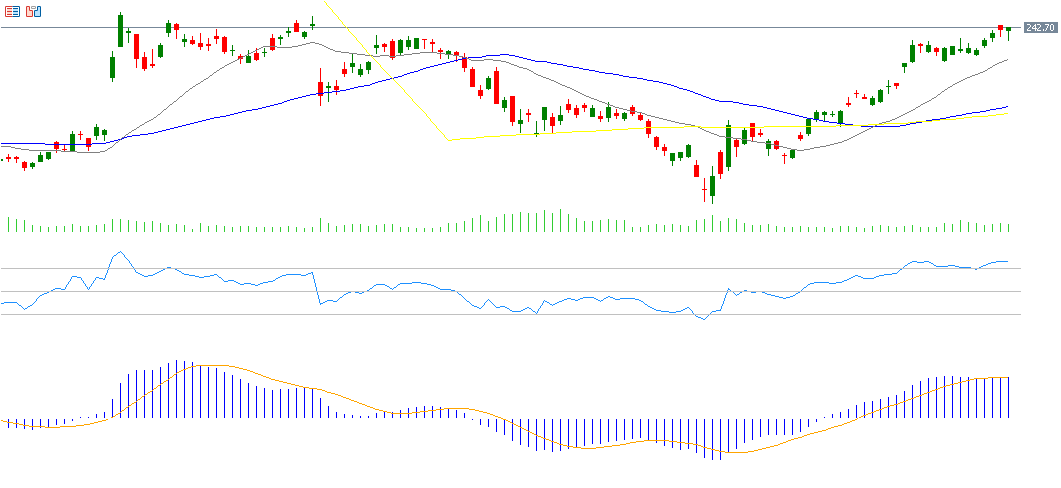
Broadcom Stock
Broadcom shares have risen by about 4% year-to-date. Markets are closely watching the company’s financial results, scheduled for Thursday, June 5, 2025. Expectations are for earnings of $1.57 per share, down from the previous reading of $10.96 per share. Revenues are projected at $14.95 billion, up from $12.49 billion previously. The RSI stands at 75, indicating overbought territory and strong bullish momentum. The MACD shows a bullish crossover between the MACD line and the signal line, adding further upward momentum to Broadcom stock.
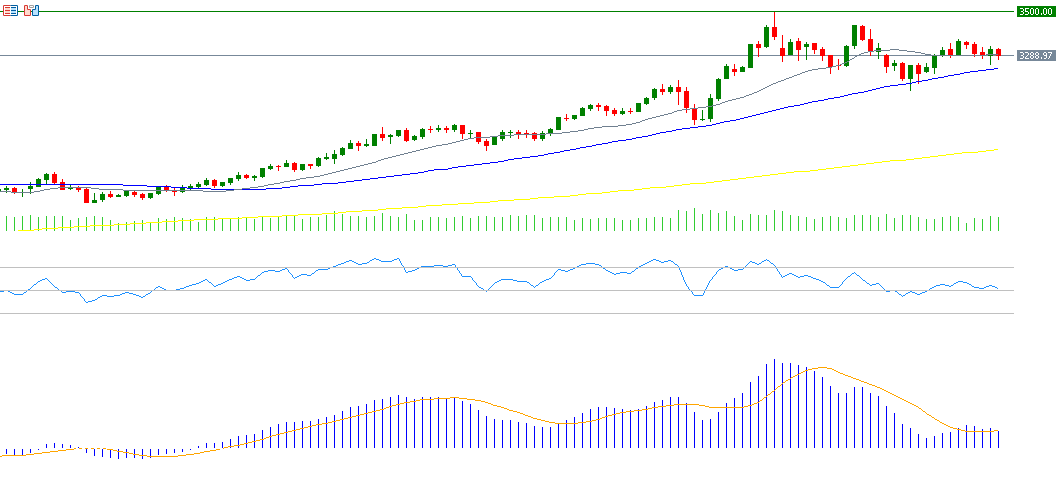
Gold
Gold prices saw a very slight increase of 0.02% over the past month. Uncertainty continues to dominate the yellow metal’s performance due to ongoing trade and geopolitical tensions, along with U.S. fiscal and monetary policies. The RSI currently sits at 51, suggesting continued upward momentum. However, the MACD shows a bearish crossover, supporting a downside trend in prices.
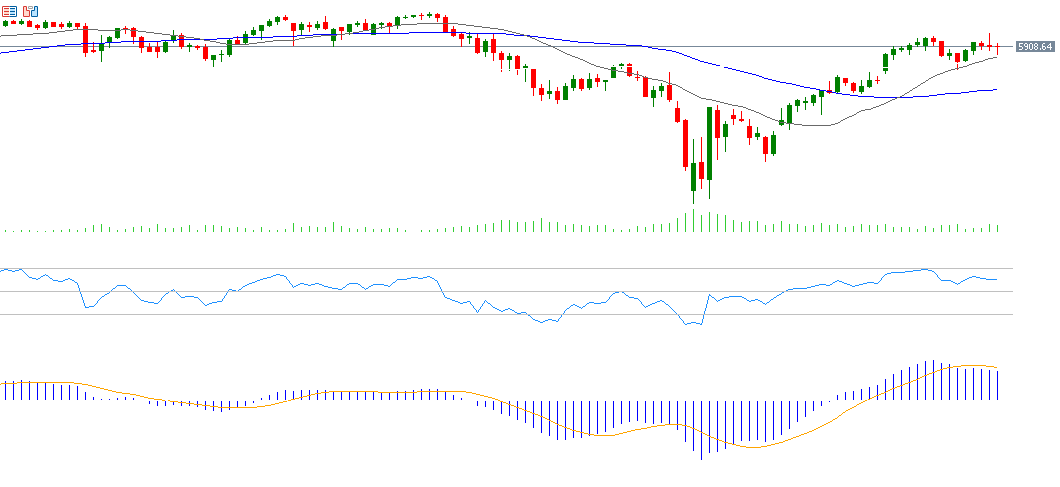
S&P 500 Index
The S&P 500 index rose by approximately 6% in May, marking its highest level since November 2023. This performance was driven by better-than-expected corporate earnings and improved economic indicators such as consumer confidence, despite ongoing trade-related uncertainties. The RSI is currently at 61, signaling bullish momentum. The MACD also shows a bullish crossover, supporting the continued upward trend of the index.
Key Events This Week
Markets are anticipating the release of several important economic indicators this week:
- Monday:
Manufacturing PMI data from Australia, Japan, the Eurozone, the UK, and the U.S., along with retail sales and GDP data from Switzerland. In the U.S., construction spending and the ISM Manufacturing PMI will be released. Markets will also closely monitor a speech by Federal Reserve Chair Jerome Powell. - Tuesday:
Caixin Manufacturing PMI from China, Consumer Price Index (CPI) data from Switzerland and the Eurozone, and factory orders and job openings data from the U.S. - Wednesday:
Interest rate decision by the Bank of Canada, with expectations of a 25 basis point cut from 2.75% to 2.50%. Services PMI data from Australia, Japan, the Eurozone, the UK, and the U.S. will be released, along with GDP data from Australia. U.S. data will include ADP Non-Farm Employment Change, ISM Non-Manufacturing PMI, and crude oil inventories. - Thursday:
European Central Bank interest rate decision, with expectations of a 25 basis point cut from 2.25% to 2.00%. Caixin Services PMI from China, Construction PMI from the UK, and U.S. Initial Jobless Claims data will also be released. - Friday:
Eurozone GDP and retail sales data, as well as U.S. data on average hourly earnings, unemployment rate, and the Non-Farm Payrolls report. Canada will release its employment change and unemployment rate figures.
Please note that this analysis is provided for informational purposes only and should not be considered as investment advice. All trading involves risk.

