The US dollar against the Chinese yuan reached 7.2720 three days ago, its highest level in four months, and is currently trading near the 7.2500 level. The exchange rate has risen by about 4% since the low of September 27, 2024, when it was 6.9691, to the peak reached three days ago at 7.2720. It has also risen by approximately 2% since the beginning of the year. As for the Chinese markets, both the Hang Seng Index and the CSI 300 Index have risen by about 13% year-to-date.
On Wednesday, November 20, the People’s Bank of China kept the one-year lending rate at 3.10%. It also kept the five-year lending rate at 3.60%, in line with expectations.
Despite all the government incentives to support the Chinese economy, recent economic data indicate that the Chinese economy is still facing weakness, reinforcing the need for further intervention by Chinese authorities to support it. Specifically:
- Corporate profits in China shrank by 4.3% in the first ten months of the year compared to the same period in 2023.
- The Consumer Price Index (CPI) in October showed a 0.3% annual growth, which was in line with expectations but lower than the previous reading of 0.4%.
- The Producer Price Index (PPI) in October registered a year-on-year decline of 2.9%, which was worse than expectations (-2.5%) and the previous reading (-2.8%).
- The Industrial Production Index in October showed a 5.3% annual growth, which was lower than expectations (5.5%) and the previous reading (5.4%).
- New loans in October grew by about 500 billion yuan, which was lower than the expected 770 billion and the previous reading of 1,590 billion.
- The Import Index in October showed a year-on-year contraction of 2.3%, which was worse than expectations (-1.5%) and the previous reading (0.3%), indicating weak domestic demand.
Despite the above negative indicators, the Export Index in October showed a growth of 12.7%, exceeding expectations of 5.0% and the previous reading of 2.4%, indicating strong external demand. Additionally, retail sales rose by 4.8% year-on-year, exceeding expectations of 3.8% and the previous reading of 3.2%.
It is worth mentioning that an important factor contributing to the upward momentum of the US dollar against the Chinese yuan is the strength of the US dollar due to Donald Trump’s arrival in the presidency, the resilience of the US economy, and the outperformance of most economic data relative to analysts’ expectations. This was further boosted by Trump’s commitment to imposing new 10% tariffs on Chinese goods.
Bank of America has predicted that emerging market currencies will fall by 5% in the first half of 2025 amid escalating trade war risks under Trump’s administration. The Chinese yuan could fall to 7.60 against the dollar in the first half of next year if the US imposes a 40% tariff on Chinese goods, or to 8.00 if the tariffs rise to 60%.
Markets are anticipating the release of China’s PMI data for both the manufacturing and non-manufacturing sectors on Saturday.
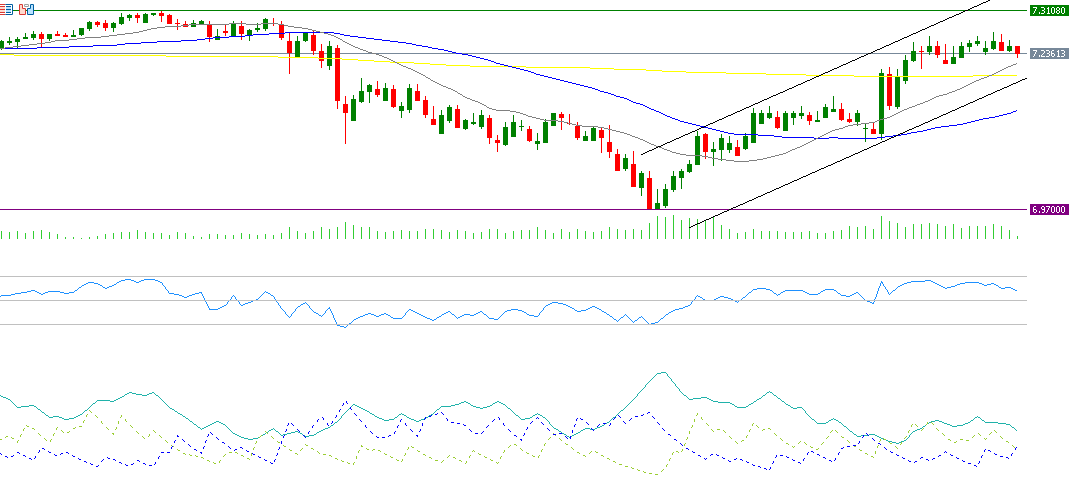
Technical indicators seem to support the US dollar against the Chinese yuan in the upcoming period for several reasons:
- Golden Cross: A bullish crossover occurred on October 25, 2024, between the 20-day moving average (gray) at 7.21448 and the 50-day moving average (blue) at 7.1354.
- Relative Strength Index (RSI): It is currently around 62 points, indicating positive momentum for the US dollar against the Chinese yuan.
- Positive Directional Movement Index (DMI+): It is around 23 points, compared to the Negative Directional Movement Index (DMI-) at around 12 points. The large gap between these two indicators indicates strong buying pressure on the US dollar against the Chinese yuan. More importantly, the Average Directional Index (ADX) is around 29 points, signaling strong momentum in this bullish trend.
As for the support and resistance levels, if the pivot point of 7.2494 for the dollar against the yuan is broken, there is a possibility that it will target the support levels of 7.2406, 7.2353, and 7.2265. If the pivot point is surpassed, it is likely to target the resistance levels of 7.2547, 7.2635, and 7.2688.
Please note that this analysis is provided for informational purposes only and should not be considered as investment advice. All trading involves risk.


