
U.S. stock markets have experienced high volatility since the beginning of this year due to uncertainty surrounding monetary, fiscal, and trade policies from U.S. authorities. However, despite this, there has been a sense of optimism in recent weeks, as the VIX index declined to 14.74 points on Friday, February 14, its lowest level in three weeks, indicating stability and investor confidence in U.S. stock markets.
Regarding the performance of major U.S. stock indices year-to-date:
- The S&P 500 has risen by approximately 4%.
- The Nasdaq 100 has increased by around 5%.
- The Dow Jones has climbed by 5%.
- The Russell 2000 (which tracks small and mid-sized companies) has grown by 2%.
The positive momentum in these indices appears to be continuing this year, supported by several factors:
- Positive Financial Results from U.S. Companies
- In the banking sector, major U.S. banks have reported revenues and profits that exceeded analysts’ expectations.
- Citigroup announced a $20 billion share buyback program, representing 14% of the bank’s market value. This move boosted the KBW Bank Index, which has surged by 9% year-to-date, outperforming the S&P 500 and Nasdaq 100, with expectations for continued momentum.
- Strong Demand for AI and Semiconductors
- Despite competition from the Chinese company DeepSeek, which has negatively impacted major U.S. tech stocks, AI-related stocks still exhibit positive momentum. For example:
- Nvidia’s stock declined by 26% from its peak of $153 on January 7 to a low of $113 on February 3. However, dip buying pushed the stock back up to $139 on Friday, marking a 23% rise from its lowest point, indicating a return to a bull market phase.
- Meta’s stock reached $740 on Friday, a new record high, driven by strong earnings results and an announcement from its CEO about capital expenditures between $60 billion and $65 billion in 2025 for AI projects—significantly higher than the $52.4 billion expected, signaling robust expansion plans.
- Apple and Alibaba have collaborated to integrate AI features into iPhones in China, which is likely to support Apple’s stock.
- Support for Domestic Industry
- Donald Trump has pledged to support U.S. industrial sectors by reducing corporate tax rates and deporting undocumented immigrants. These policies could boost employment among U.S. citizens and positively impact industrial stocks.
Challenges and Potential Risks Facing U.S. Stocks
Despite the positive outlook, U.S. equities face several challenges and risks:
- Expectations of Prolonged High Interest Rates
- Inflation pressures remain, as reflected in recent data:
- Core and headline Consumer Price Index (CPI) readings were 3.0% and 3.3%, exceeding expectations.
- Producer Price Index (PPI) reached 3.5%, still far from the Federal Reserve’s 2% target.
- In testimony before Congress last week, Fed Chair Jerome Powell emphasized that he is not in a hurry to cut interest rates, signaling that rates will stay elevated for the foreseeable future.
- Higher interest rates could push up U.S. Treasury yields, strengthening the U.S. dollar, which could, in turn, weaken high-risk assets like equities, especially stocks of U.S. exporters.
- Uncertainty Over Potential Tariffs
- There remains uncertainty regarding Trump’s proposed tariffs on imported goods, including the rates, timing, and target countries.
It’s also worth noting that valuations for these stocks are already high, which could lead to profit-taking or a correction in the near term. However, the ongoing investment in AI continues to support bullish sentiment in the market.
Key Market Catalyst: Nvidia’s Earnings on February 26
Markets are closely watching Nvidia’s financial results and forward guidance on February 26, which will have a strong impact on major indices like the Nasdaq 100 and S&P 500.
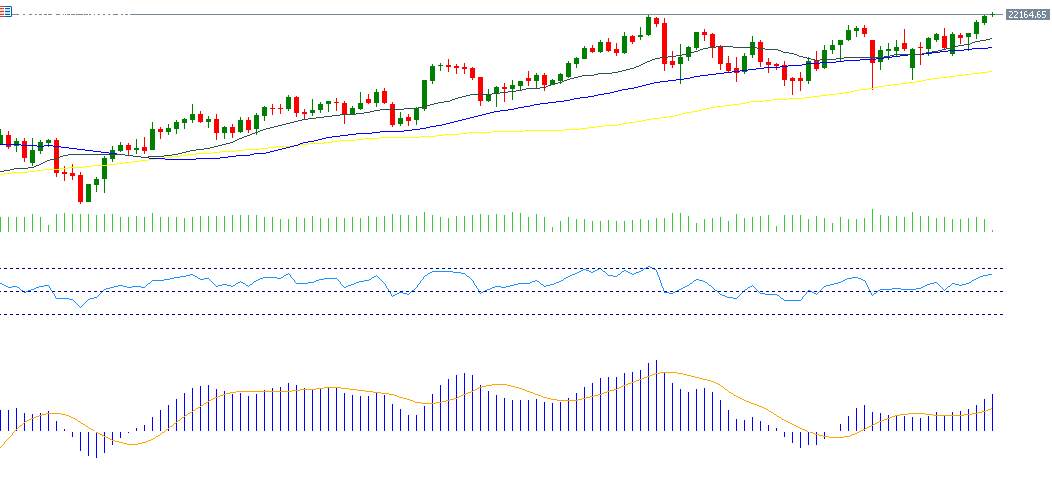
Technical Analysis of Nasdaq 100
Despite market challenges, technical indicators continue to support the Nasdaq 100:
- Moving Averages
- The 20-day, 50-day, and 200-day moving averages are in an upward trend, with:
- The 20-day moving average above the 50-day moving average.
- The 50-day moving average above the 200-day moving average.
- The 20-day, 50-day, and 200-day moving averages are in an upward trend, with:
- MACD Indicator
- A bullish crossover is observed, where the MACD line (blue) crosses above the signal line (orange), reinforcing an uptrend.
- Relative Strength Index (RSI)
- Currently at 62, indicating positive momentum for the index.
Key Resistance Level: 22,133 Points
The biggest challenge for the Nasdaq 100 is to break above 22,133 points, its all-time high recorded on December 16, 2024.
Please note that this analysis is provided for informational purposes only and should not be considered as investment advice. All trading involves risk.


