Location & Language

Zenfinex Global Limited regulated by the Financial Services Authority (FSA) of Seychelles (SD092)

Positive Momentum of the FTSE 100 Index: Technical Analysis and Economic Factors

The FTSE 100 Index continues its upward trend for the fourth consecutive day, reaching a new record high of 8,549 points yesterday. It is currently trading near the 8,500-point level, and the positive momentum for this index appears to persist in the upcoming period, having risen by approximately 5% since the beginning of the year.

These notable gains in British stocks are attributed to several factors, including:

  • Weakness of the British Pound, which has fallen by about 10% against the dollar since the peak of September 26, 2024, when it stood at 1.3434, to the low recorded on January 13, 2025, which was 1.2100. It is currently trading near 1.2300.
  • Decline in the headline Consumer Price Index (CPI) on an annual basis, showing growth of 2.5%, which is lower than expectations and the previous reading (2.6%). Additionally, the core CPI, which excludes food and energy, also decreased on an annual basis, recording a growth of 3.2%, which is below expectations (3.4%) and the previous reading (3.5%), encouraging the Bank of England to continue reducing interest rates this year.
  • Decline in UK bond (Gilts) yields across various maturities. For example, the yield on 10-year bonds fell by about 6% since the peak of January 9, 2025, when it stood at 4.925%, to the current levels near 4.650%.
  • China as one of the UK’s largest trading partners, with strong recent economic data from China, such as outperforming GDP, export, retail sales, and industrial production indicators, which exceeded analysts’ expectations, providing positive momentum for British stocks.

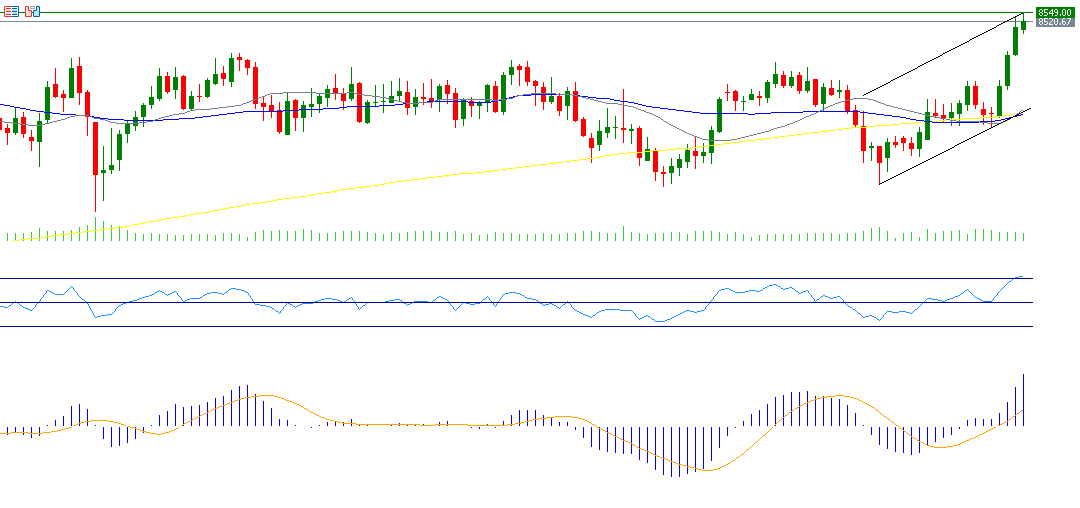
From a technical perspective, the indicators support the continued rise of the FTSE 100 for the following reasons:

  1. Bullish crossover between the 20-day moving average, which stands at 8,239 points, and the 50-day moving average, which stands at 8,223 points. This may indicate a continued upward trend for the FTSE 100 index.
  2. The Relative Strength Index (RSI), currently at 72, indicating the overbought zone, which suggests continued positive momentum for the FTSE 100 index.
  3. A bullish crossover between the MACD (in blue) and the Signal Line (in orange), indicating positive momentum for the FTSE 100 index.

Please note that this analysis is provided for informational purposes only and should not be considered as investment advice. All trading involves risk.


Back

Popular Posts

Bullish Momentum for the U.S. Dollar Index Despite Economic Challenges

Overview of Last Week’s Key Economic Events

Bitcoin Roars Back: 39% Surge Since April Signals Bull Market Entry

Comprehensive Analysis of Crude Oil Price Movements: Geopolitical, Economic, and Technical Factors

Lorem Ipsum

Lorem ipsum dolor sit amet, consectetur adipiscing elit.

Here are some related articles you may find interesting:

Market Insights​

May 13, 2025

Bullish Momentum for the U.S. Dollar Index Despite Economic Challenges

The U.S. Dollar Index, which measures the greenback's performance against a basket of six major currencies, climbed yesterday to its highest level since April 11,...

Market Insights​

May 12, 2025

Overview of Last Week’s Key Economic Events

Last week witnessed several significant global economic developments. The U.S. Federal Reserve decided to keep interest rates unchanged, while labor market data showed improvement and...

Market Insights​

May 9, 2025

Bitcoin Roars Back: 39% Surge Since April Signals Bull Market...

Bitcoin prices reached $109,356—a record high registered on January 20 of this year—before retreating to around $75,000 on April 7. Currently, Bitcoin is trading above...

Market Insights​

May 8, 2025

Comprehensive Analysis of Crude Oil Price Movements: Geopolitical, Economic, and...

Crude oil prices have risen by approximately 8% since hitting a low of $58.44 on Monday this week, climbing to a peak of $63.17 as...

Ready to Elevate Your Trading Journey?

Open a Taurex account and start trading today.

We’re Sorry

Access to tradetaurex.com
is unavailable in your region

tradetaurex.com is required to abide by global laws and therefore the information on this site is not directed at residents of the United States, Canada, North Korea, Iran, Myanmar, Belgium, Spain, France, Japan, South Korea or any particular countries and is not intended for distribution to, or use by, any person in an country or jurisdiction where such distribution or use would be contrary to local law or regulation.

1 Hour Trading Consultation

This site is registered on wpml.org as a development site. Switch to a production site key to remove this banner.