
The Nasdaq 100 index recorded a level of 19,153 points yesterday, marking its lowest level since September 12, 2024. It then closed at 19,225 points. The index has declined by 14% since the peak it reached on February 19, 2025, which was 22,223 points, to yesterday’s low. It has also dropped by around 9% since the beginning of this year until yesterday’s close.
But how have the seven stocks, or the “Magnificent 7,” performed since the start of the year up until yesterday’s close?
- Tesla stock has declined by approximately 40%.
- Apple stock has declined by approximately 16%.
- Nvidia stock has declined by approximately 14%.
- Alphabet stock has declined by approximately 14%.
- Amazon stock has declined by approximately 12%.
- Microsoft stock has declined by approximately 10%.
- Meta stock has increased by approximately 1%.
What are the main factors putting pressure on U.S. stocks?
- A wave of capital outflows from U.S. stocks to Chinese stocks, specifically in the technology sector, where the Hang Seng Tech Index has risen by about 29% since the start of this year.
• Concerns about the U.S. economy entering a recession.
• The trade war between the Trump administration and several countries such as Canada, Mexico, China, and the European Union, especially regarding tariffs, which has caused investors to move out of high-risk assets such as U.S. stocks and cryptocurrencies.
• Weak recent U.S. economic indicators, such as the non-farm payroll report, where 151,000 new jobs were added, lower than the expected 159,000. The unemployment rate also rose to 4.1%, higher than the expectations and previous reading of 4.0%. Additionally, the core Consumer Price Index (CPI) and Producer Price Index (PPI) showed slower growth, registering 2.8% and 3.1%, respectively, below expectations and previous readings. The PPI showed an annual growth of 3.2%, lower than the expected 3.3% and previous reading of 3.7%.
It is also worth noting that research houses have downgraded U.S. stocks while upgrading Chinese stocks.
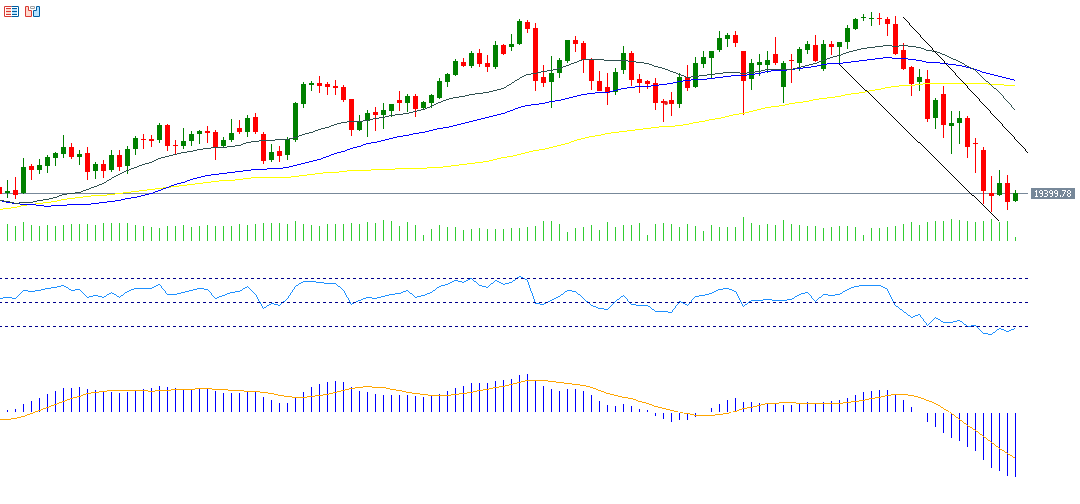
It seems that technical indicators may put pressure on the Nasdaq 100 index in the upcoming period for several reasons:
First: A bearish crossover between the 20-day moving average (in gray), which stands at 20,823 points, and the 50-day moving average (in blue), which stands at 24 points as of March 6, 2025, supports the continuation of the bearish trend for the Nasdaq 100 index in the coming period.
Second: The Relative Strength Index (RSI) currently stands at 29 points, indicating it is in oversold territory, which suggests negative momentum for the Nasdaq 100 index.
Third: The MACD indicator (in blue) is below the SIGNAL LINE (in orange) and is also in the negative zone, which provides bearish momentum for the Nasdaq 100 index.
Please note that this analysis is provided for informational purposes only and should not be considered as investment advice. All trading involves risk.


