By Samir Al Khoury,
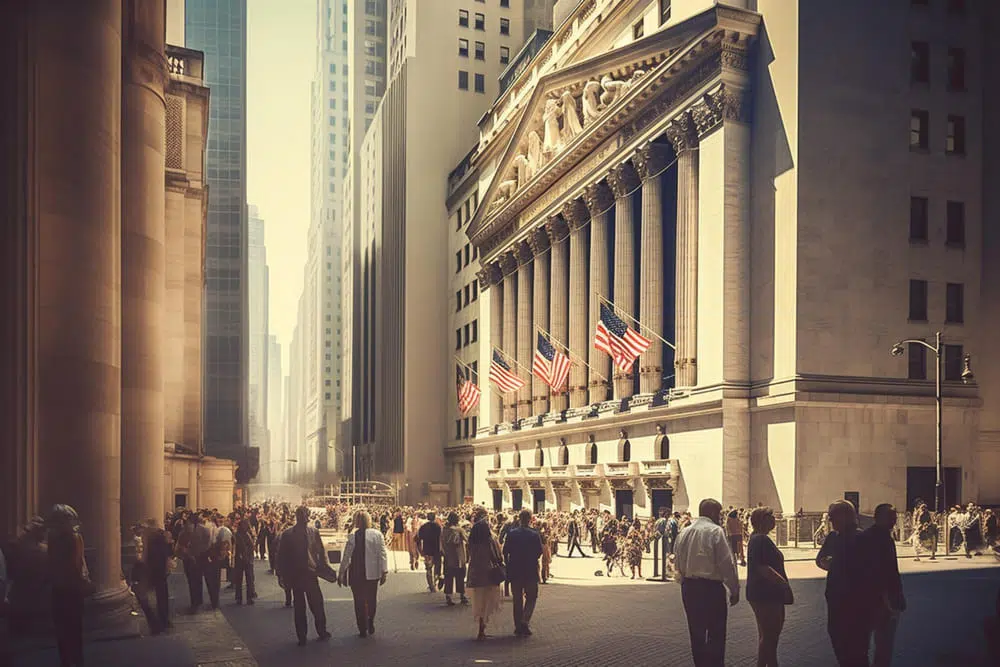
The S&P 500 index recorded 5,490 points yesterday, marking its highest level ever. This index has risen by 16% since the beginning of this year until yesterday’s close. It continues to set records, with yesterday being its thirtieth record close this year. The rise was led by Nvidia shares, which became the first chip company to reach a market value of $3.35 trillion, surpassing the market values of Microsoft ($3.32 trillion) and Apple ($3.29 trillion).
Prominent Factors Supporting US Stocks:
-
Strong Demand for Chips and AI-Related Products: The surge in technology and AI-related stocks has significantly boosted the index.
-
Slowdown in US Economic Data: Slower consumer and producer price indices and retail sales may prompt the Federal Reserve to reduce interest rates this year. Stock investors are betting on two rate cuts by the Fed, in September and December, which would provide positive momentum for stocks.
Markets are closely awaiting the release of the manufacturing and services purchasing managers’ indices in the United States on Friday, which will have a direct impact on stock market movements.
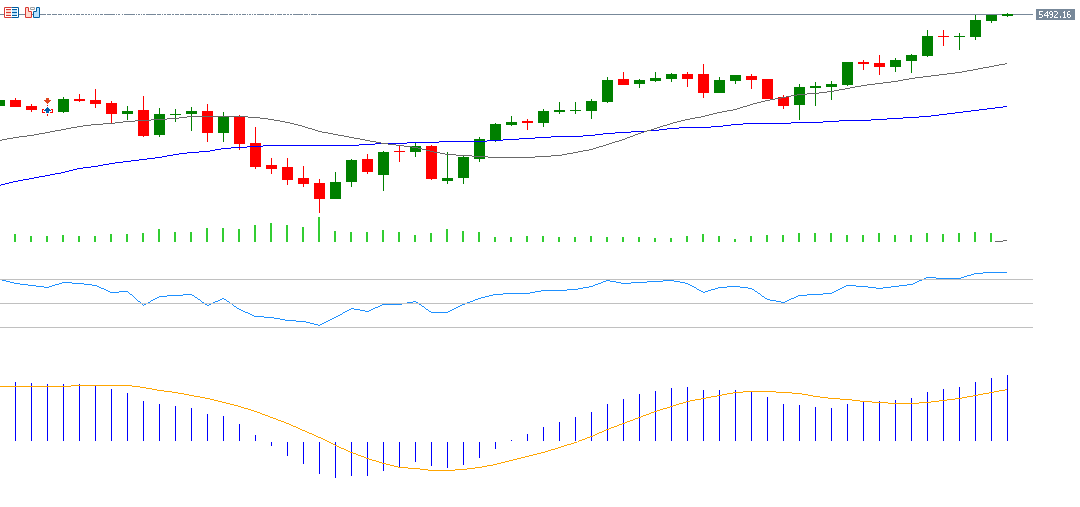
Technical Indicators Supporting the S&P 500:
-
Moving Averages:
The 20-, 50-, and 200-day moving averages are regular and trending upward. The 20-day average exceeds the 50-day average, and the 50-day average exceeds the 200-day average.
-
Relative Strength Index (RSI):
Currently recording 77 points, the RSI is in the overbought zone, indicating bullish momentum for the S&P 500.
-
MACD Indicator:
The MACD is positive, with the MACD line (blue) exceeding the signal line (orange), indicating positive momentum for the S&P 500 index.
By addressing these factors and indicators, the S&P 500 is poised for continued growth in the next stage.
Please note that this analysis is provided for informational purposes only and should not be considered as investment advice.
Taurex is the trading name of Zenfinex Global Limited, Stochastic Africa SL Ltd, Zenfinex Global LLC, and Zenfinex Limited.
Zenfinex Global Limited is registered in the Republic of Seychelles with registration number: 8428731-1 and is regulated by the Financial Services Authority of Seychelles (license number SD092). Its registered office address is F20, 1st Floor, Eden Plaza, Eden Island, Seychelles.
Stochastic Africa (SL) Limited is a company registered in Sierra Leone with Company Number: SL270319STOCH05271 and is licensed by the Bank of Sierra Leone under license number BSL/SAL/2023 and with the registered office at 148D Wilkinson Road, Freetown, Sierra Leone.
Zenfinex Global LLC is a company registered with the Financial Services Authority in Saint Vincent and the Grenadines under registered number 138 LLC 2019. Its registered office is Hinds Building, Kingstown, Saint Vincent, and the Grenadines.
Zenfinex Limited is a company registered in England and Wales under registered number: 11077380. Authorised and regulated by the Financial Conduct Authority under firm reference number 816055. Its registered office is 4th Floor, 4 Eastcheap, London, EC3M 1AE, United Kingdom.
*All trading involves risk.


