
The U.S. dollar continues its downward trend against the Thai baht, hitting 32.82 yesterday—its lowest level since October 2, 2025—and is currently trading near the 33.00 level. The pair has dropped approximately 6% from the peak of 34.98 recorded on April 9, 2025, down to yesterday’s low of 32.82. It is also down about 4% year-to-date.
Recent economic data from Thailand highlights the resilience of the local economy, with key indicators showing notable strength:
- Exports grew by 17.70% year-over-year in March, exceeding the previous reading of 13.90% and marking the highest growth since March 2022.
- Imports rose by 9.40% year-over-year in March, compared to the prior reading of 4.10%.
- Industrial Production contracted by 0.66% year-over-year in March, which was better than the forecast of -2.20% and the previous figure of -3.92%.
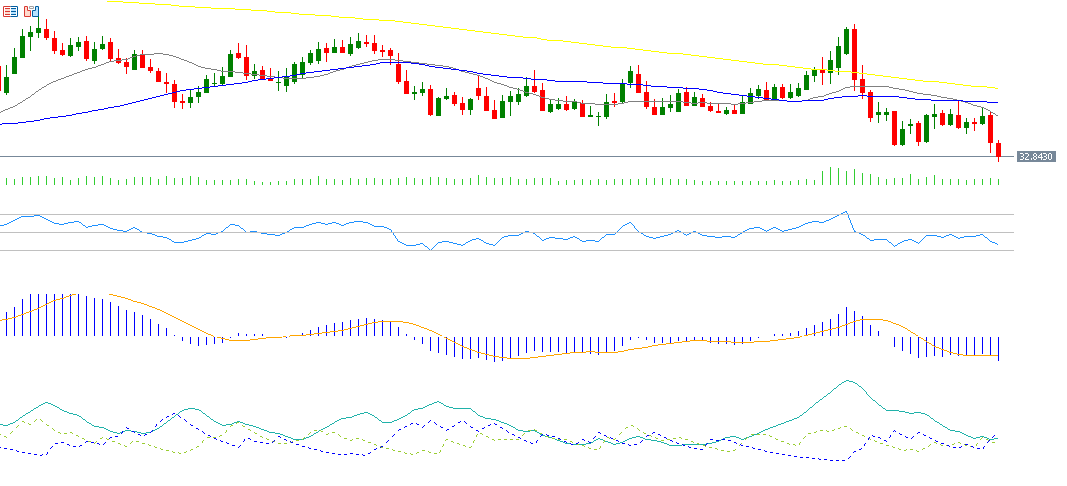
Technical indicators support the continuation of the USD/THB bearish trend in the near term for several reasons:
- A bearish crossover has occurred between the MACD line (blue) and the Signal Line (orange), suggesting continued negative momentum.
- The Relative Strength Index (RSI) is currently at 38 points, indicating bearish momentum.
- The Positive Directional Index (DMI+) stands at around 14 points, compared to 24 points for the Negative Directional Index (DMI-), reflecting a wide gap that underscores strong selling pressure on the pair.
Please note that this analysis is provided for informational purposes only and should not be considered as investment advice. All trading involves risk.


