
The USD/MXN exchange rate continues its downward trend, reaching 19.2270 today — its lowest level since October 8, 2024. The pair has declined by approximately 9% from its peak on April 9, 2025 (21.0785) to yesterday’s low. It has also dropped nearly 8% year-to-date.
Recent economic data from Mexico suggest that the economy is beginning to show signs of recovery:
- The Consumer Price Index (CPI) rose to 3.93% year-over-year in April, exceeding expectations of 3.90% and the previous reading of 3.80%.
- GDP in the first quarter of the year grew by 0.2%, surpassing expectations (0.0%) and improving from the previous negative reading of -0.6%.
- The unemployment rate decreased to 2.60%, compared to the previous figure of 2.70%.
- The trade balance posted a surplus of 3.442 billion pesos, beating both the expected 2.600 billion and the prior reading of 2.212 billion.
A key driver behind the downward momentum of the USD/MXN pair has been the weakening of the U.S. dollar against most global currencies — particularly emerging market currencies. This follows Moody’s downgrade of the U.S. credit rating from AAA to Aa1, coupled with a slowdown in certain U.S. economic indicators, including consumer confidence, which has fallen to its second-lowest level on record.
Additionally, the Bank of Mexico recently cut interest rates by 50 basis points during its May 15 meeting — from 9.00% to 8.50% — in line with market expectations.
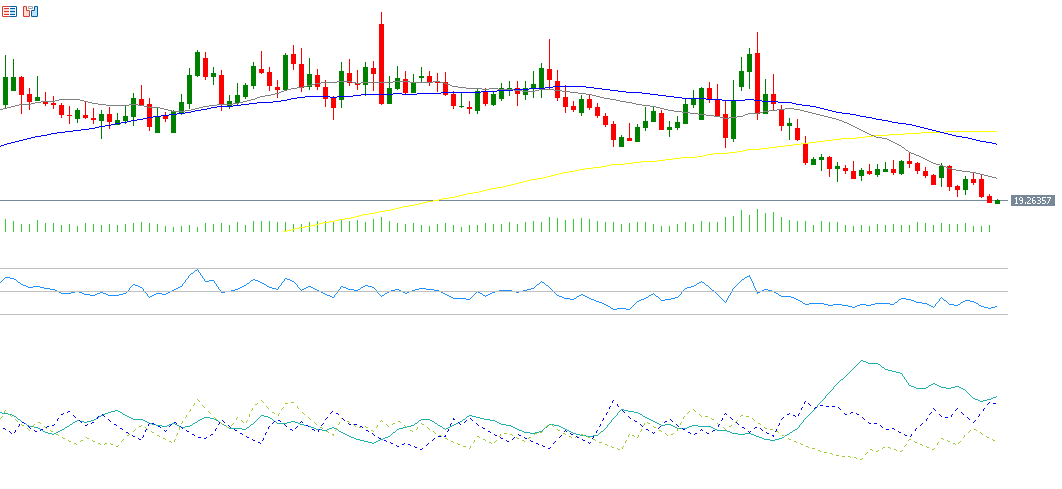
From a technical perspective, if the pivot point at 19.2867 in the USD/CAD pair is breached to the downside, the price could target support levels at 19.2339, 19.1954, and 19.1426. Conversely, if the price breaks above the pivot, it may aim for resistance levels at 19.3252, 19.3780, and 19.4165.
In terms of technical indicators, the Relative Strength Index (RSI) is currently at 36, indicating bearish momentum. The Positive Directional Indicator (DMI+) is around 14, while the Negative Directional Indicator (DMI-) is approximately 25, highlighting a significant gap between the two — a sign of strong selling pressure on the USD/MXN pair.
Please note that this analysis is provided for informational purposes only and should not be considered as investment advice. All trading involves risk.

