
The USD/SGD exchange rate recorded a level of 1.2843 yesterday, its lowest since July 28, 2025, and is currently trading near this level. The pair has declined by about 6% since the beginning of the year to date.
Recent economic data from Singapore show that the Singapore Dollar has demonstrated resilience, as:
- The Non-Oil Export Index rose by 13.00% year-on-year, surpassing expectations of 5.00% and the previous reading of -3.90%.
- Retail sales increased by 2.3% year-on-year, compared to the previous reading of 1.3%.
- The Industrial Production Index grew by 8.00% year-on-year, exceeding expectations of 7.10% and the prior reading of 3.60%.
- GDP for the second quarter of this year grew by 5.6%, beating expectations of 0.7% and the previous figure of -0.5%.
- The Business Expectations Index for Q2 rose by 5.00 points, surpassing the previous reading of -6.00.
It is worth noting an additional factor that gave positive momentum to the Singapore Dollar: the weakness of the US Dollar against most foreign currencies amid uncertainty about the US economy, with recent slowdowns in employment, manufacturing, and services data. This pushed markets to price in two rate cuts by the US Federal Reserve this year, with the first expected in September, which put downward pressure on the greenback, alongside the ambiguity regarding the Fed’s independence.
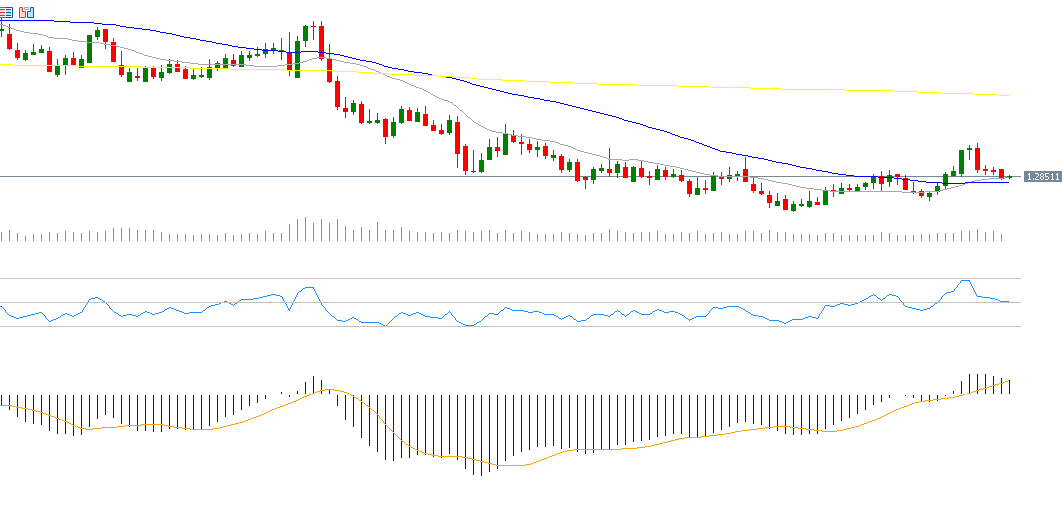
Technically, the Relative Strength Index (RSI) is at 50, indicating neutral momentum. Any downside breakout below this level could signal a bearish trend for the USD/SGD pair. Regarding the MACD indicator, the MACD line is approaching the signal line, and any bearish crossover would confirm negative momentum for the pair.
Support and Resistance Levels:
If the pivot point at 1.2878 is broken downward, the pair may move toward the following support levels: 1.2858, 1.2841, and 1.2821.
If the pivot point is broken upward, resistance targets will be at 1.2895, 1.2915, and 1.2932.
Please note that this analysis is provided for informational purposes only and should not be considered as investment advice. All trading involves risk.

